Technical Analysis
Interpret market data to identify patterns and trends to make more educated predictions.

Simple vs. Exponential Moving Averages
Build on your charting basics and try simple moving averages for long-term charts and exponential moving averages for short-term views.

7 Basic thinkorswim® desktop Chart Drawing Tools
Understanding how to use thinkorswim® desktop's drawing tools can help traders identify trends and patterns. Here's an overview of seven commonly used chart drawing tools.

Price Movement Indicator: Market Maker Move
Is the market pricing in a greater-than-typical move in a stock? Check the Market Maker Move indicator on the thinkorswim platform. It can help inform your trading decisions.
How to Use Volume-Weighted Indicators in Trading
The volume-weighted average price (VWAP) indicates the average price of an intraday period weighted by volume. Here's how to use VWAP in technical trading.

How to Trade Simple Moving Averages
A stock's simple moving average can help traders identify when trends are established or broken. Here's how to employ them in your own trading.
Breadth Check: Strength and Weakness Trend Tracker
Market breadth can help gauge strength or weakness. Methods include tracking the number of stocks trading above or below moving averages or making new highs or lows.
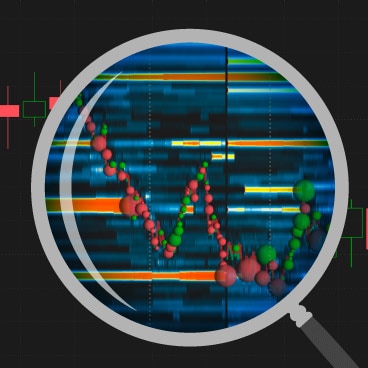
Using Bookmap on thinkorswim®
Bookmap is a charting application available on thinkorswim that offers visual insight into real-time market data. Traders can use it to better visualize supply, demand, and volume.
Filtering the Market Using Technical Analysis
Identify and evaluate potential trade opportunities using technical analysis tools, including trendlines, moving averages, volume, and more.

Using the Gold/Silver Ratio to Measure Sentiment
The gold/silver ratio tends to increase amid market uncertainty. It is one of several indicators, like the VIX, that can gauge investor sentiment.

3 Strength Indicators for Assessing Stock Momentum
Deciding if a trend is forming—and how strong it might be—can make or break a trade. Here are three strength indicators technical traders use to assess a stock's momentum.