Technical Analysis
Interpret market data to identify patterns and trends to make more educated predictions.

3 Smart Skills for Informed Trading
Trading involves multiple skills, and traders can potentially improve their trading acumen—and potentially their results—by following these tips that may be associated with more balanced returns.
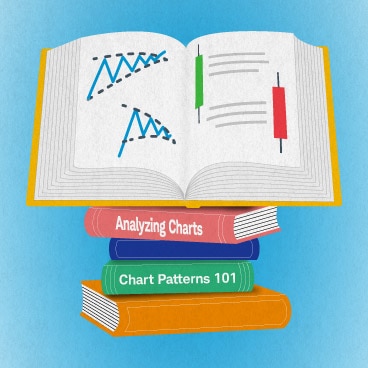
How to Read Stock Charts and Trading Patterns
Learn how to read stock charts and analyze trading chart patterns, including spotting trends, identifying support and resistance, and recognizing market reversals and breakout patterns.
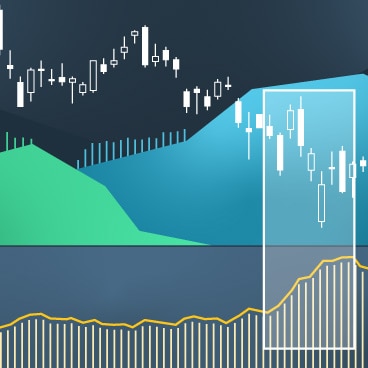
The Average True Range Indicator and Volatility
The Average True Range indicator can help traders analyze volatility, place stops and limits, and manage position size.

Bollinger Bands: What They Are and How to Use Them
Bollinger Bands® help you identify sharp, short-term price movements and potential entry and exit points.

How to Pick Stocks: Fundamentals vs. Technicals
Find out how you can use these two stock-picking strategies together.

Using RSI to Assess Your Long-Term Holdings
Relative strength index is often used by traders to determine when to buy or sell a stock. Here's how long-term investors can put it to work in their own portfolios.

The Ins and Outs of a Swing Trade
Swing traders look to capture profits from short-term swings within longer-term up- or downtrends. Here's a look at some swing trading basics.

Technical Indicators: 3 Trading Traps to Avoid
Traders use a stock's price patterns to help identify entry and exit points, but those patterns can be misleading. Here's how to avoid three common technical trading traps.

6 Ways to Get Started With thinkorswim®
Schwab's trading specialists share the top features of the thinkorswim trading platform traders should know.

Identifying Head-and-Shoulders Patterns in Stock Charts
Identifying so-called head-and-shoulders patterns can be tricky.