Filtering the Market Using Technical Analysis
As a new trader, picking the right stocks from the thousands out there can feel like finding a needle in a haystack. Don't worry—there's a way to make this easier without needing to be a market wizard. Using technical analysis (a method to study price patterns) and the user-friendly tools on the thinkorswim® platform, traders can narrow down their choices by focusing on the strongest sectors and stocks. This article breaks this process into simple steps, perfect for beginners, with no jargon overload.
Technical analysis indicators
Technical analysis helps traders spot patterns in stock prices. Here are four beginner-friendly tools and how to use them on thinkorswim.
Support and resistance: Think of support and resistance as price "floors" and "ceilings" where a stock's price tends to stop falling or rising. A support level is where buyers step in, pushing the price up. A resistance level is where sellers take over, pushing the price down. These levels can potentially help traders decide when to buy or sell. To apply these on thinkorswim, go to the Charts tab, select Drawings, and then Drawing Tools to draw horizontal lines on the stock's high and low points. The Price Level tool (the $ in the Drawing Tools drop-down menu) lets traders track these across different time periods, such as daily or weekly charts, to see if a stock might break out or continue the trend.
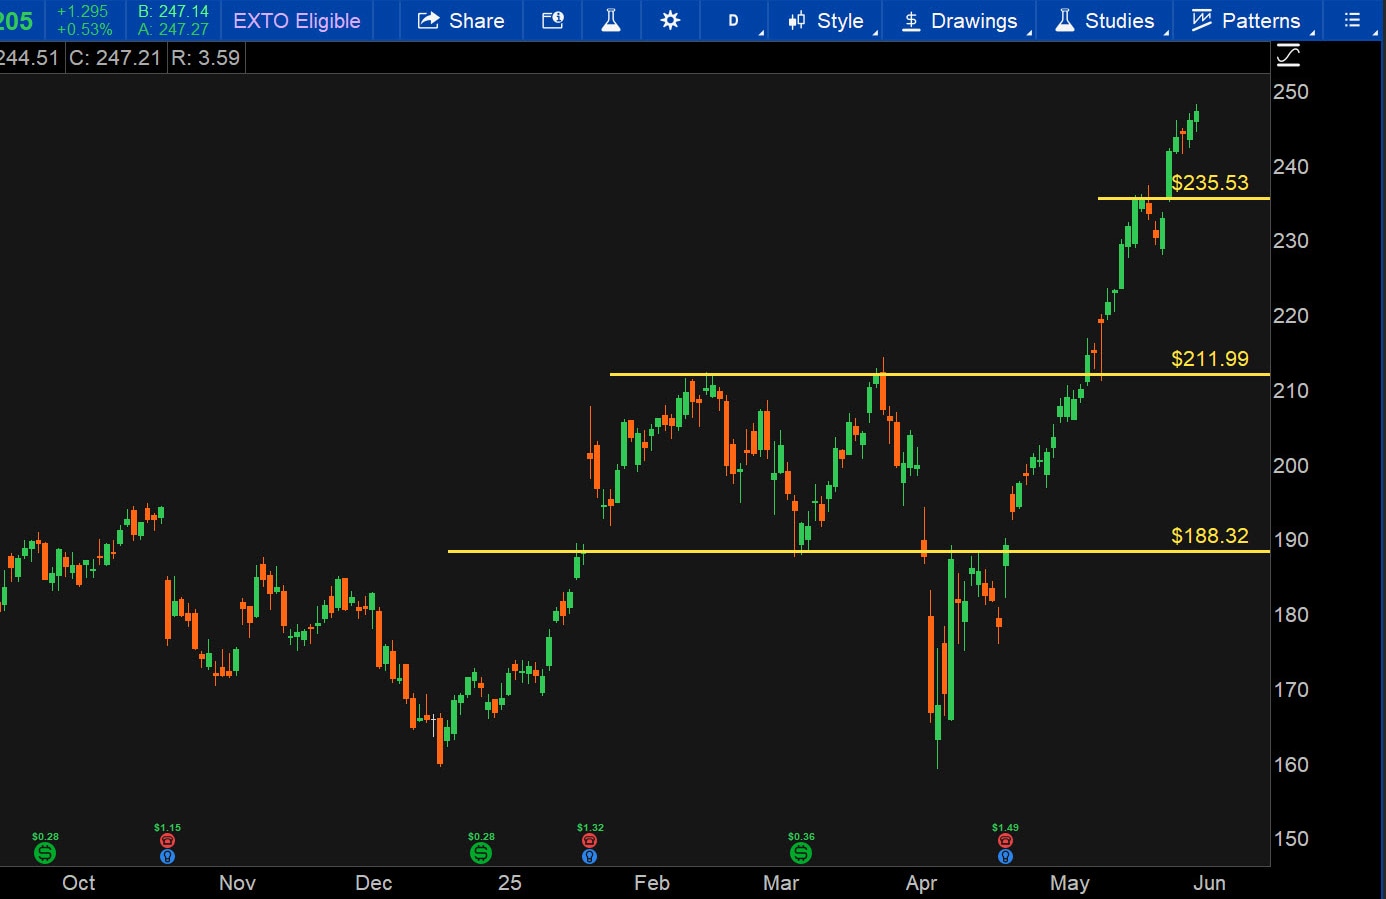
Source: thinkorswim platform
Trendlines: These show if a stock's price is climbing or falling over time. To determine a stock's trend, connect the lowest price points with a line in the Charts tab using the Trendline tool, or /, from the Drawing tools drop-down menu. If the line slopes up, the stock is on an upward path (bullish). For a downward trend, connect the high points—if the line slopes down, the stock is falling (bearish). Traders can also use the Channel tool, or //, to draw two lines that frame the price movement, showing how strong the trend is over a week or month.
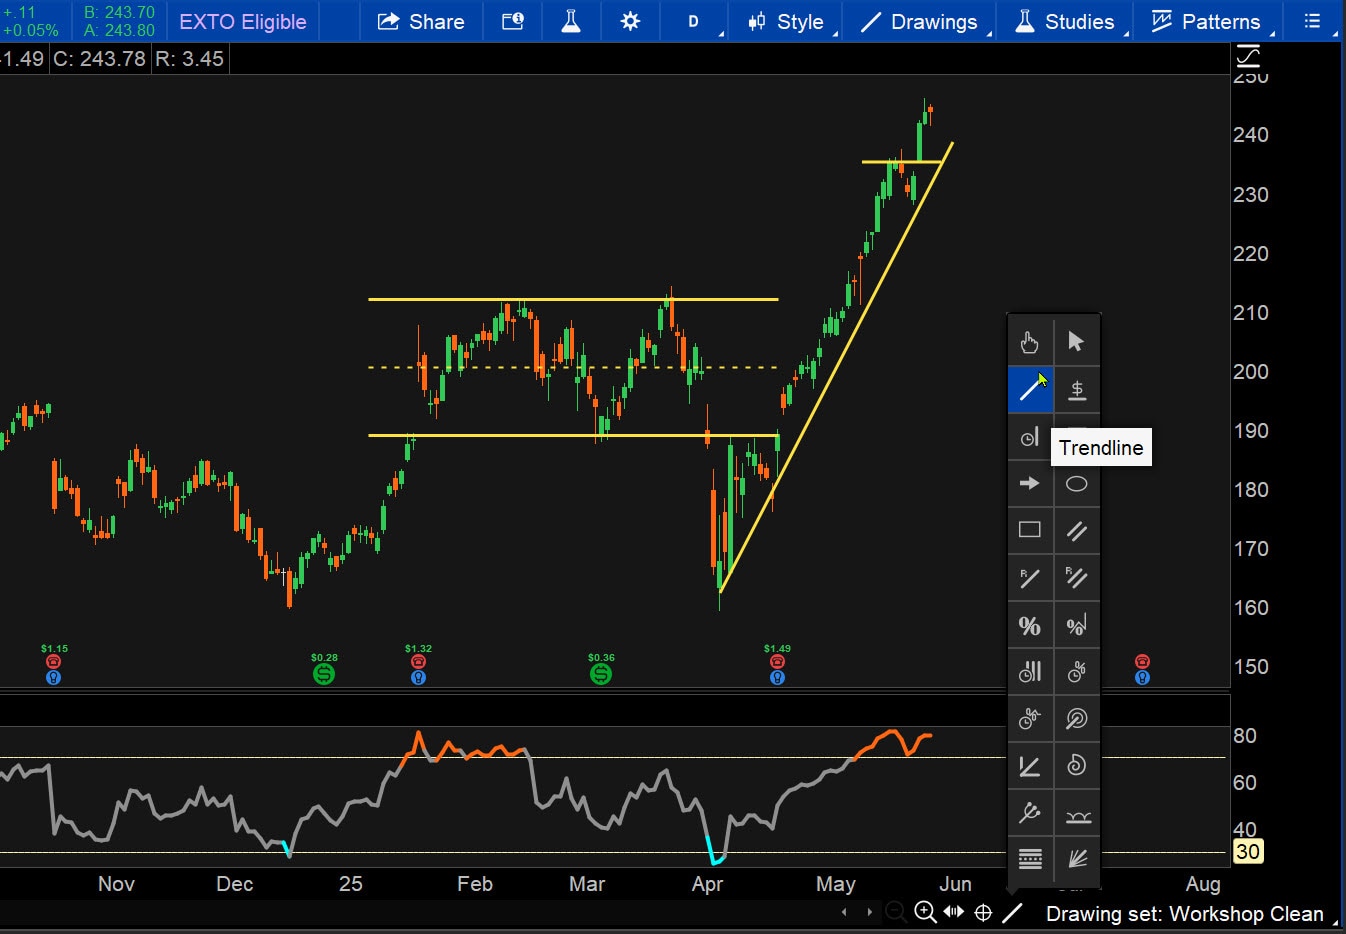
Source: thinkorswim platform
Moving averages: These are like a stock's average grade over time, smoothing out the ups and downs of a stock's price. For example, a 20-day moving average is the average price over 20 trading days. If a stock's price is above this average, it's doing better than usual. To find these on thinkorswim, go to the Charts tab, select Studies, and add a Simple Moving Average (SMA) for 20 or 50 days. If a short-term average (like the 20-day SMA) crosses above a longer one (like the 50-day SMA), it's a signal the stock might keep rising. The Moving Average Crossover study highlights these moments automatically.
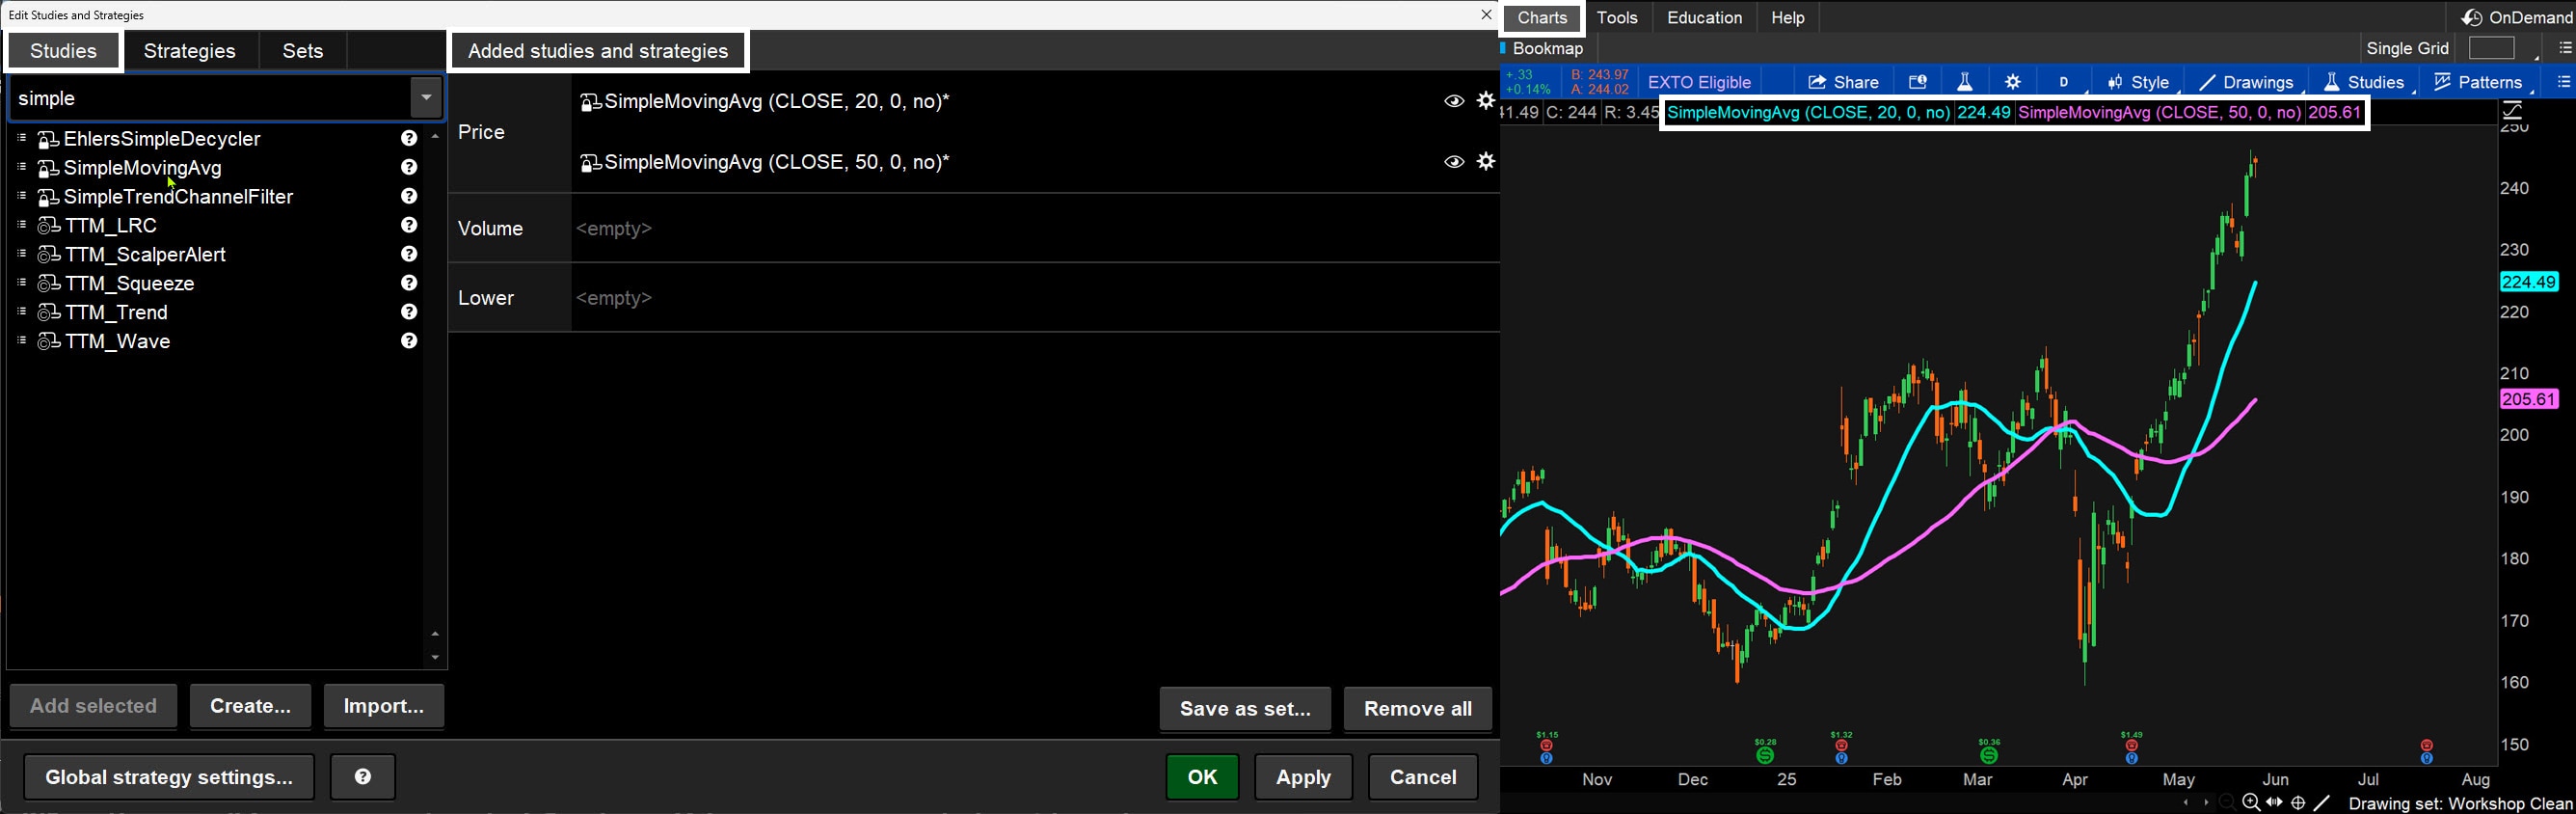
Source: thinkorswim platform
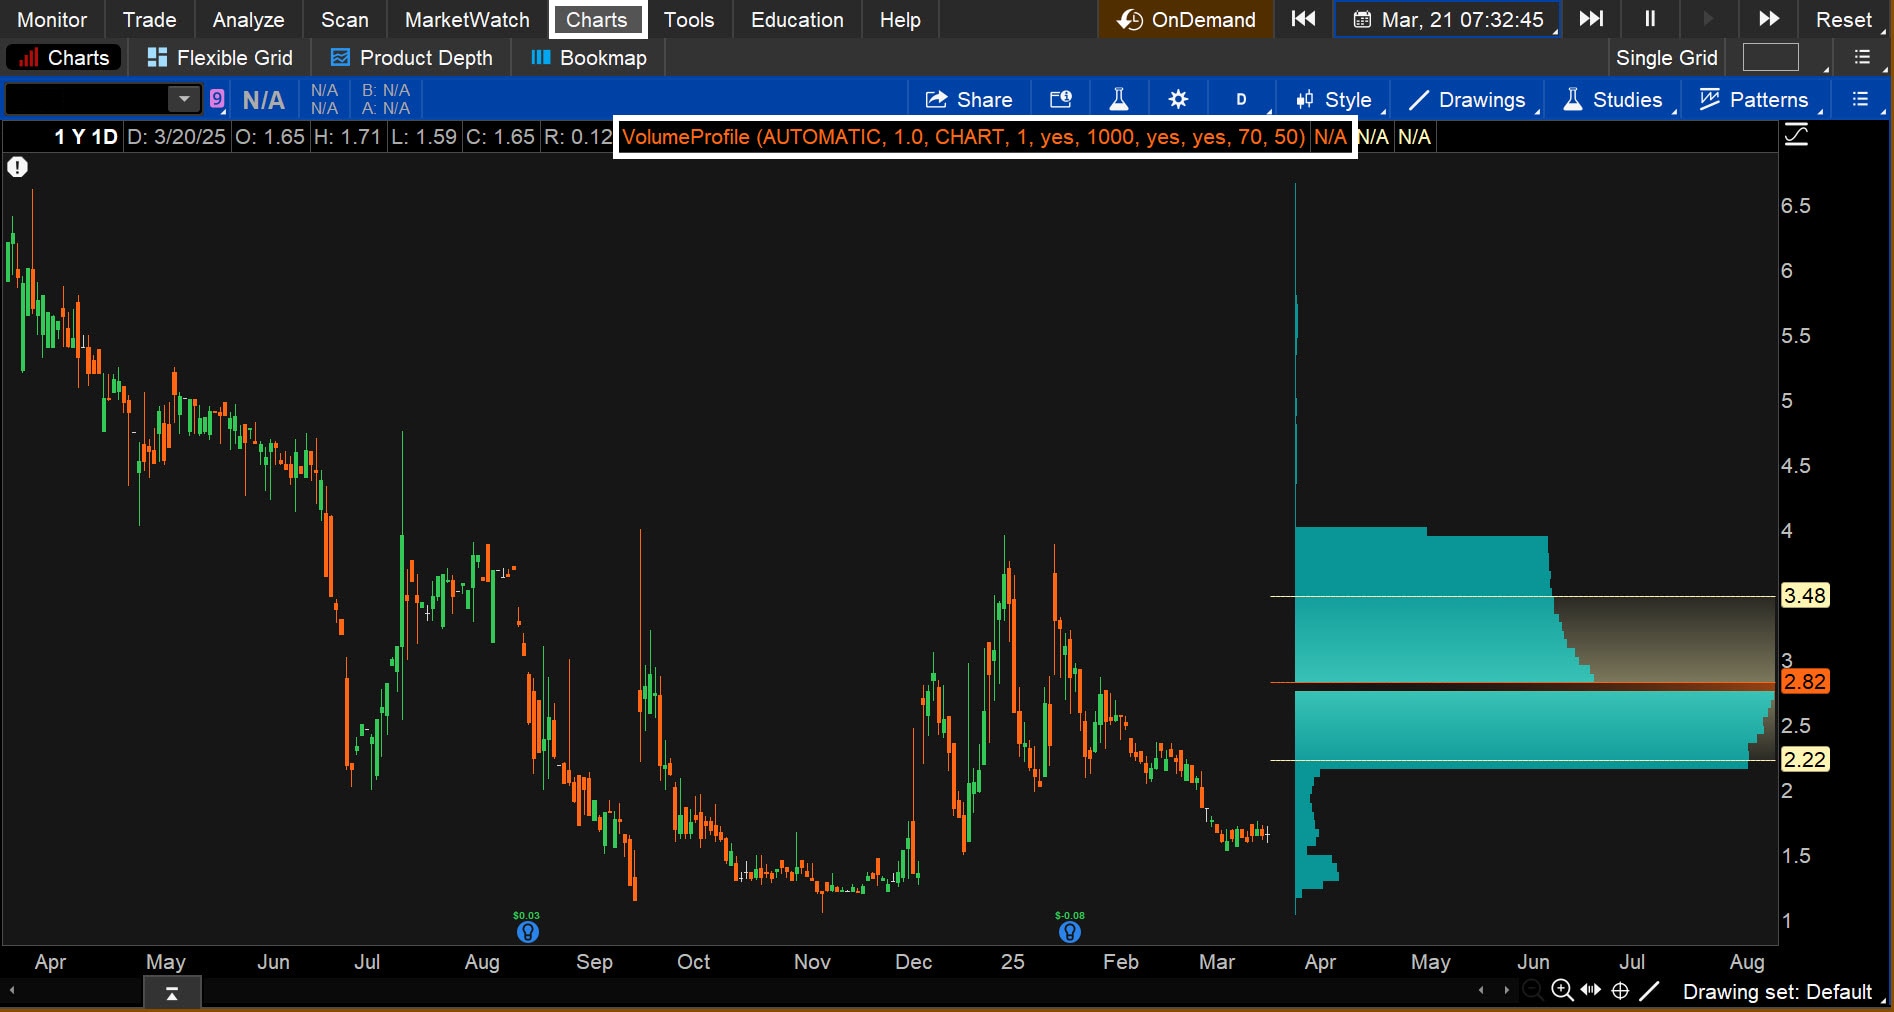
Volume: This shows how many shares are being traded. High volume means lots of traders are buying or selling, giving more weight to a price move. Low volume suggests less trader interest. To track this on thinkorswim, from the Charts tab, look at the volume bars at the bottom of a chart. Traders can add the VolumeAvg study to see if today's trading is busier than usual. They can also use the Volume Profile study to see when trading is heaviest, helping them potentially confirm if a price move is strong.
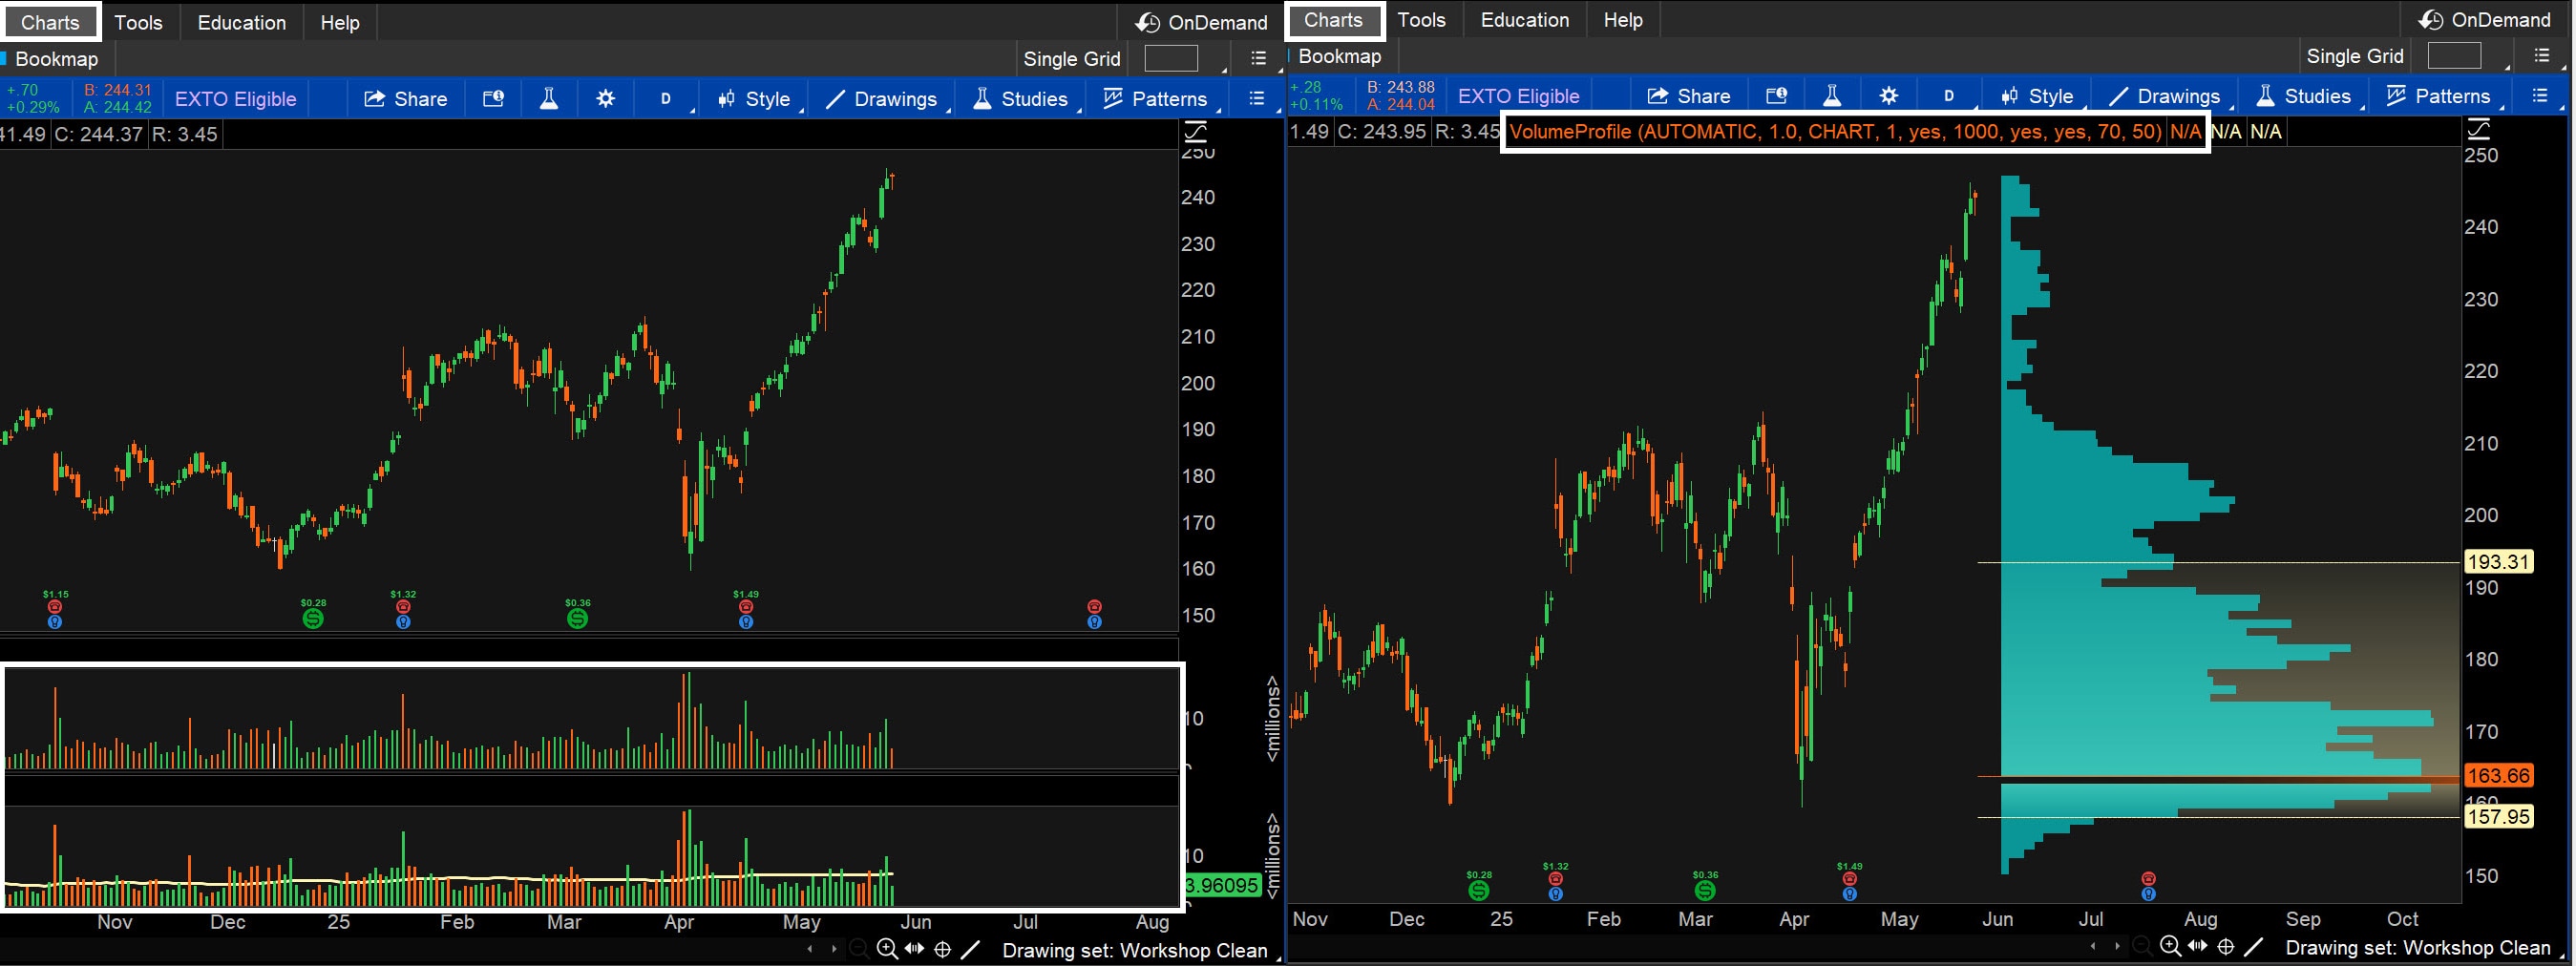
Source: thinkorswim platform
Filtering the market
Start by looking at the overall market to see if it's trending up or down. Major indexes like the S&P 500® index (SPX), Dow Jones Industrial Average®, or Nasdaq Composite® give traders a snapshot. Using thinkorswim, from the Charts tab, type in an index's symbol (like SPX for the S&P 500), and draw a trendline to see its direction. Use the VolumeAvg study to check if trading volume supports the trend. For a quick overview, the MarketWatch tab's Heat Map shows which indexes are hot (green) or not (red). Traders can also use the Scan tab to find stocks in an index that are above their moving average or have high volume, giving them a starting point.
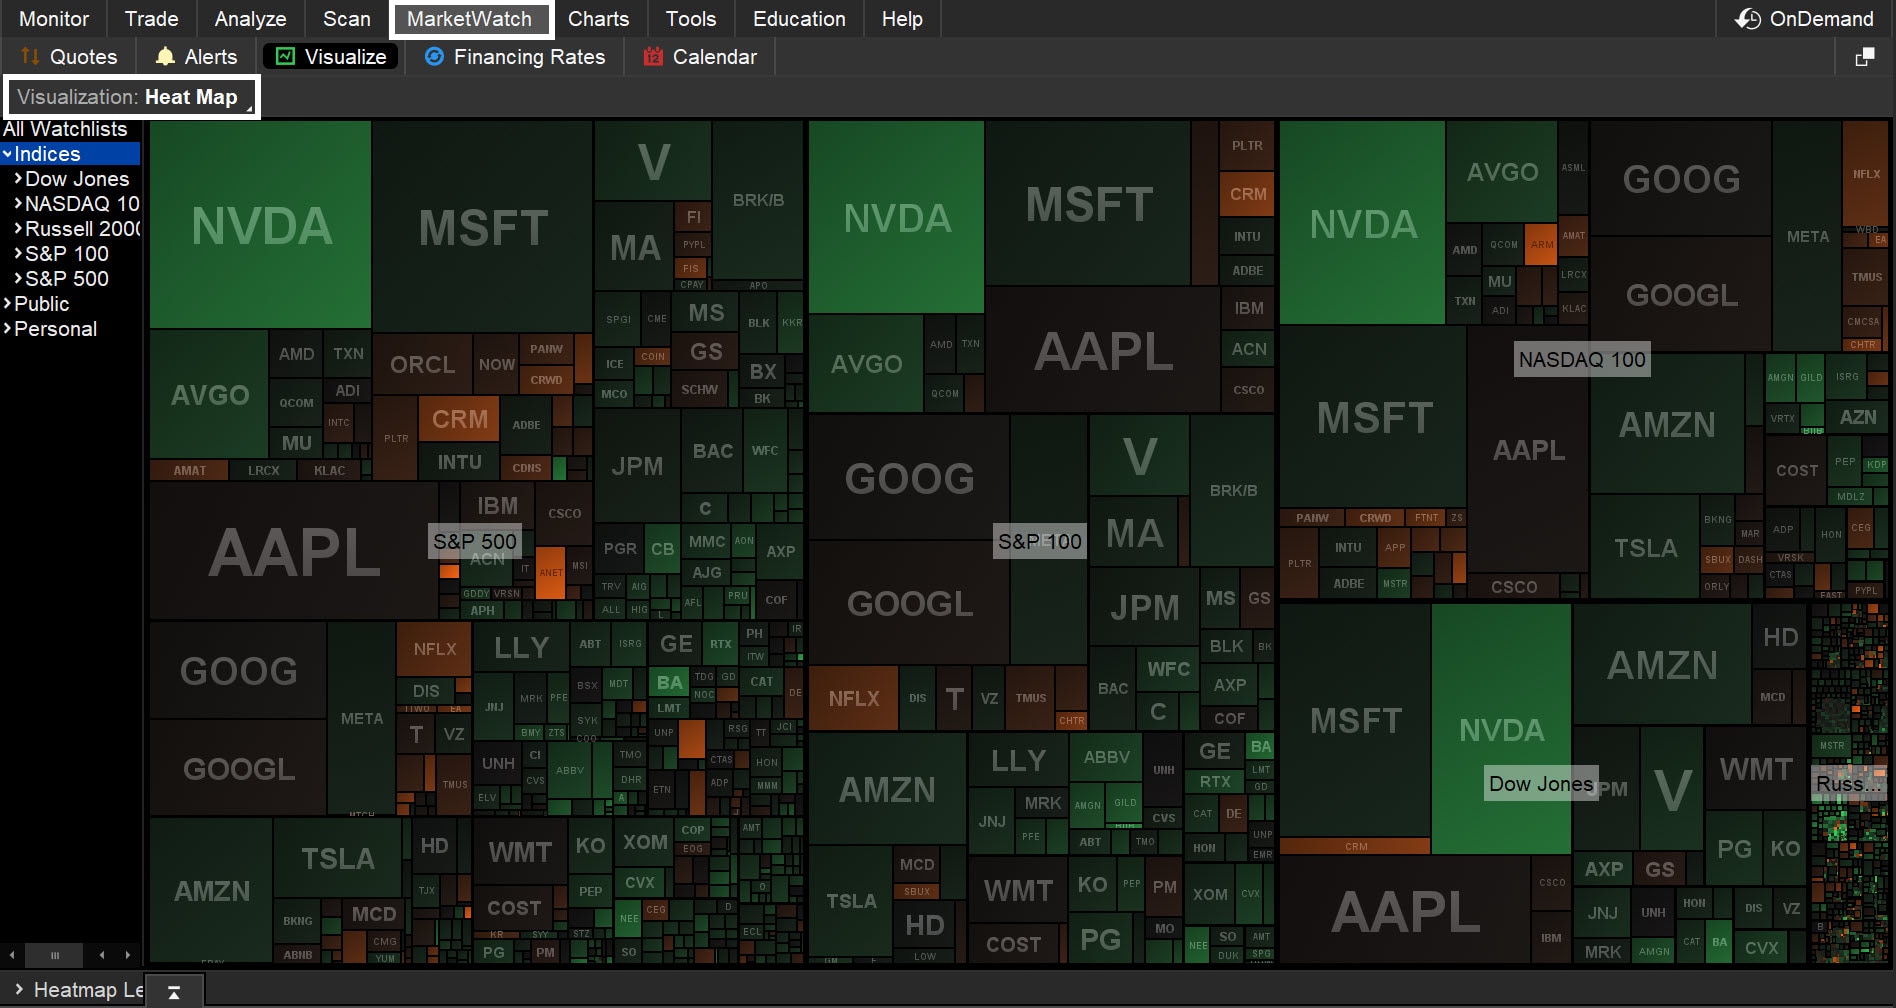
Source: thinkorswim platform
Filtering sectors
The market is split into sectors like technology or health care. Some sectors shine when the market is up, while others lag when it's down. On thinkorswim, go to the MarketWatch tab, select the Quotes subtab, and find the Core Sectors public watchlist. Look at the charts of these segments of the market in the Charts tab to see if they're trending up or down using trendlines or moving averages. The Stock Hacker feature of the Scan tab can rank sectors to show the top two or three performers. For example, filter for sectors with prices above their 20-day moving average to find the leaders.
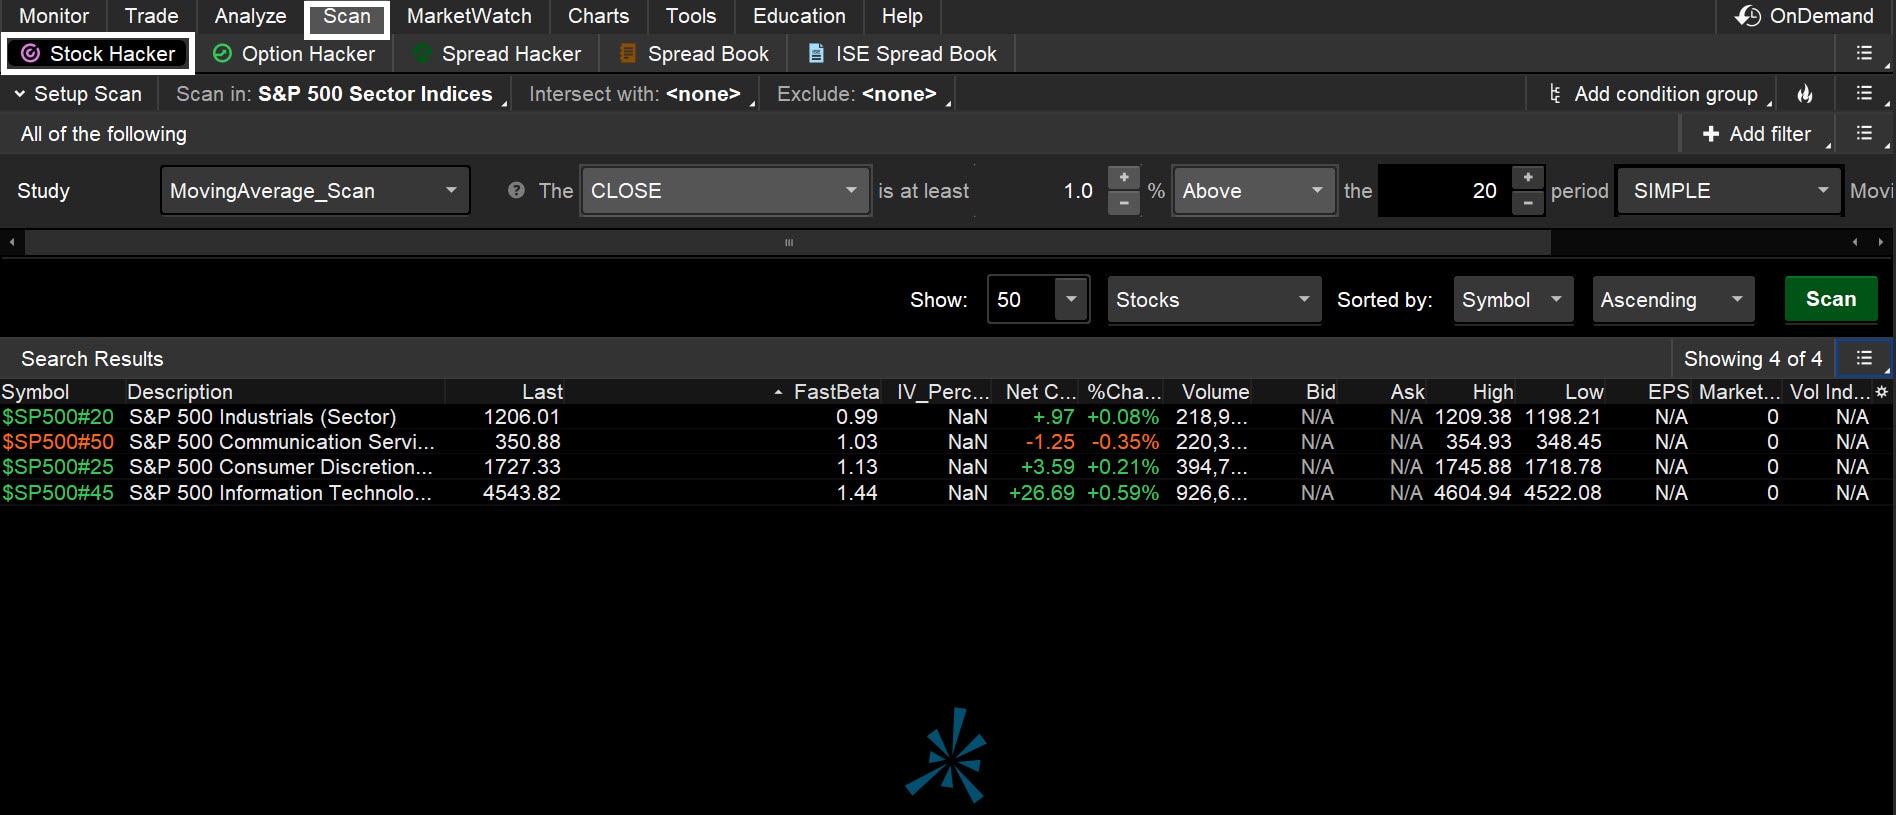
Source: thinkorswim platform
Filtering stocks
Now, using those leading sectors, zoom in on the top stocks. On thinkorswim's Scan tab, use Stock Hacker to filter stocks with:
- Prices above their 50-day moving average (showing strength)
- Volume higher than usual (indicating lots of trading interest)
- A recent jump above a resistance level (use the Gap Up study)
Save these stocks as a watchlist for easy tracking. Check each stock's chart in the Charts tab, adding simple studies like RSI (to see if a stock's overbought or oversold) from the Studies drop-down menu. If you're trading fast, on the Trade tab, consider the Active Trader tab, which shows live buying and selling action to help traders time their moves.
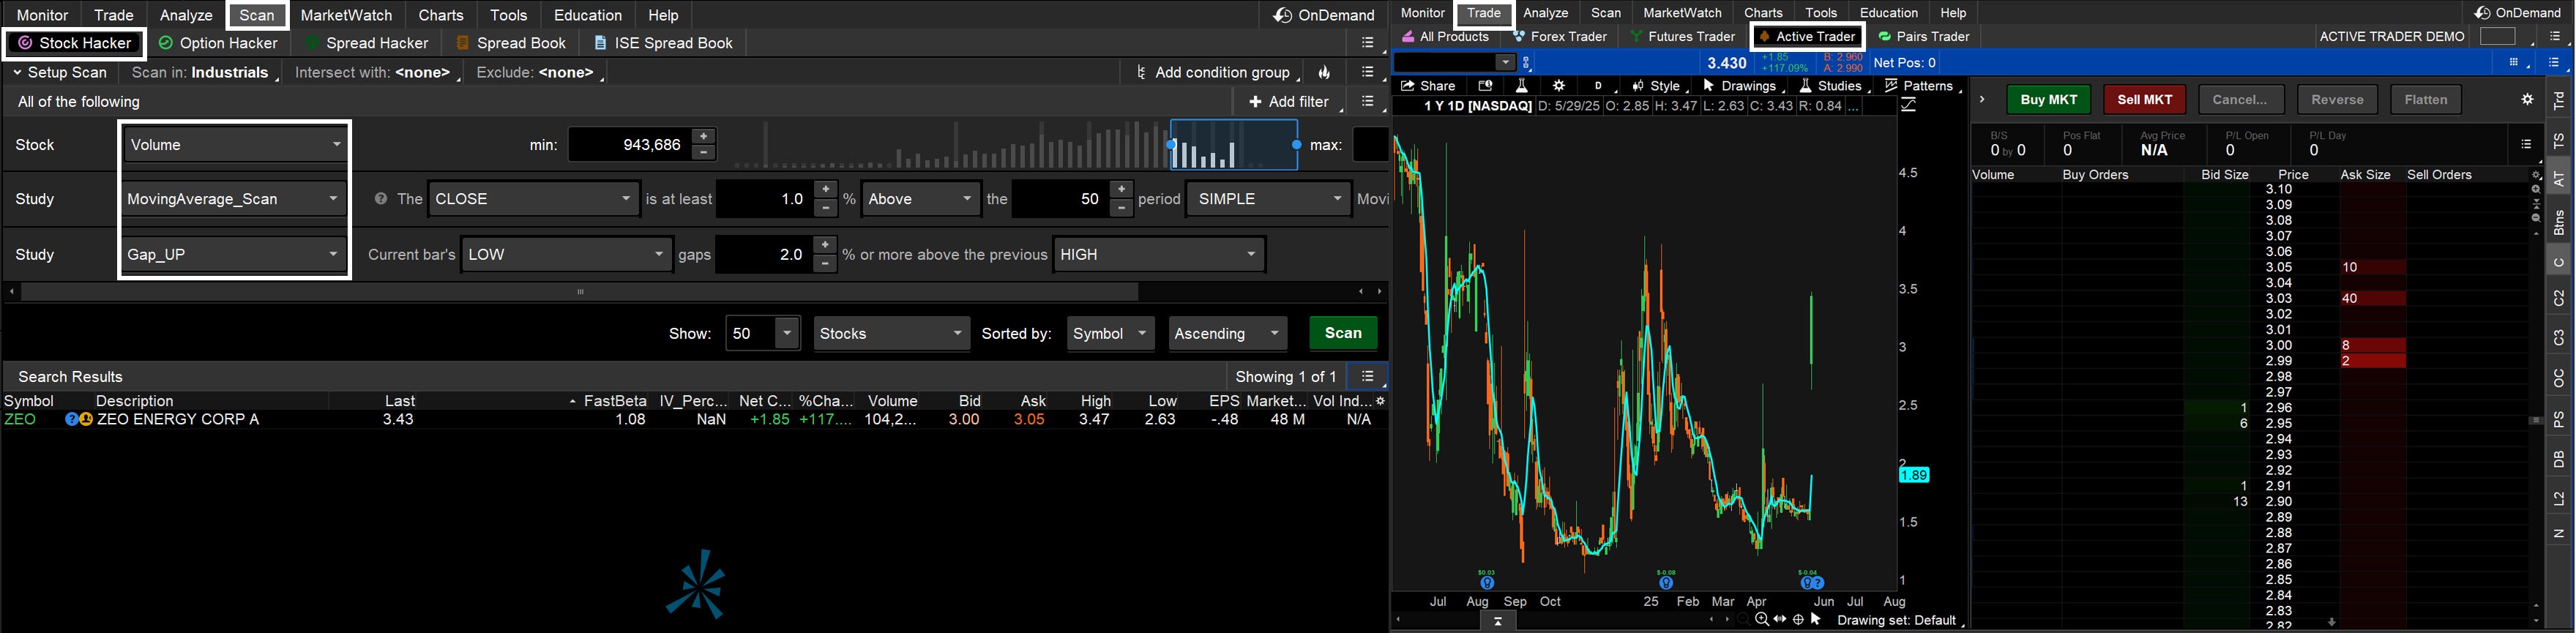
Source: thinkorswim platform
Test and trade with confidence
With a short list of stocks, look at their charts to find trades that fit your goals. If you like waiting for bargains, check stocks near support levels with the Fibonacci Retracement tool to spot good buy points.
If you chase big moves, look for stocks breaking past resistance with strong volume as confirmed by the Volume Profile tool.
Source: thinkorswim platform
Before risking real money, practice using thinkorswim's paperMoney®* feature—it's like a trading simulator where you can't lose cash. The OnDemand feature lets you replay past market days to test your ideas.
Bottom line
Technical analysis and thinkorswim's tools—like Charts, Scan, and Stock Hacker—make it easier to find potentially great stocks without getting overwhelmed. By focusing on market trends, strong sectors, and top stocks, you can trade with a clear plan, even as a beginner. Take it slow and practice before risking any real money.