7 Basic thinkorswim® desktop Chart Drawing Tools

Understanding how to use the thinkorswim® desktop platform's robust chart-drawing tools can help traders identify a stock's price trends and patterns. Yet with more than 20 drawing tools available on Schwab's signature trading platform, you may be wondering where to start. Let's examine some of the most popular tools based on what traders are looking to accomplish.
Getting started
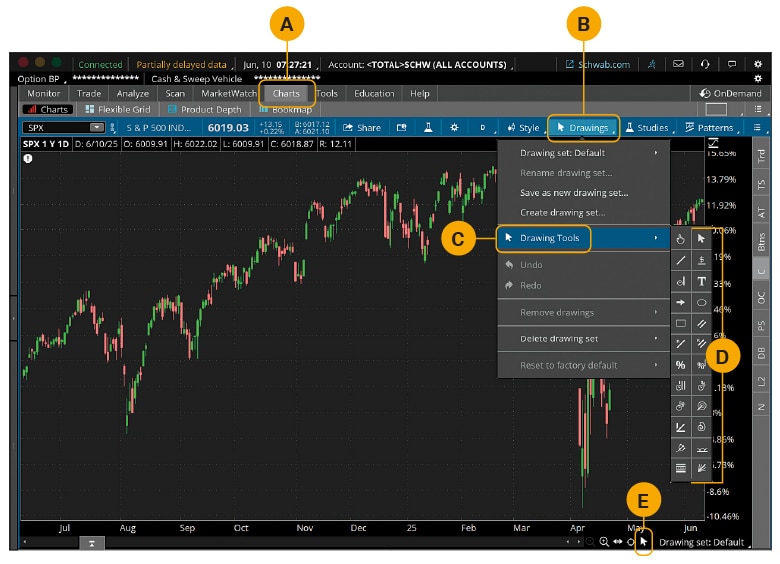
Log in to the thinkorswim desktop app. From 🅐 Charts, click 🅑 Drawings, then move your cursor over 🅒 Drawing Tools to view the 🅓 available tools.
Tip
You can also access the tools by right-clicking anywhere on the chart and selecting Add a drawing, or by clicking the 🅔 Active Tool icon at the bottom of the screen.
Source: thinkorswim® desktop platform.
Source: thinkorswim desktop platform.
Visualizing price movements
Source: thinkorswim desktop platform.
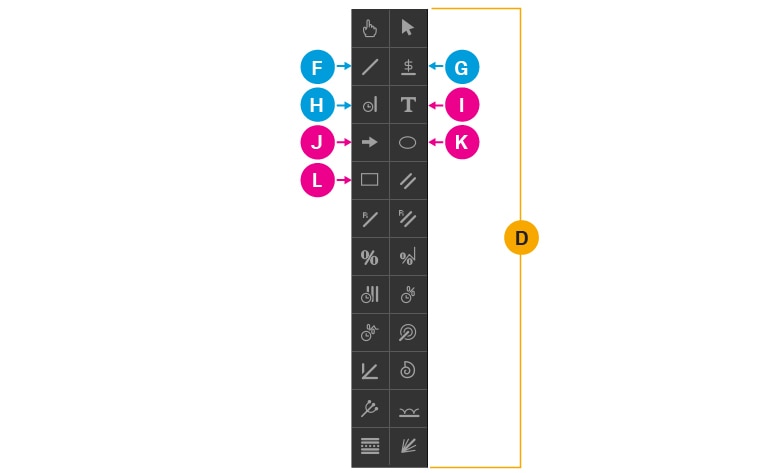
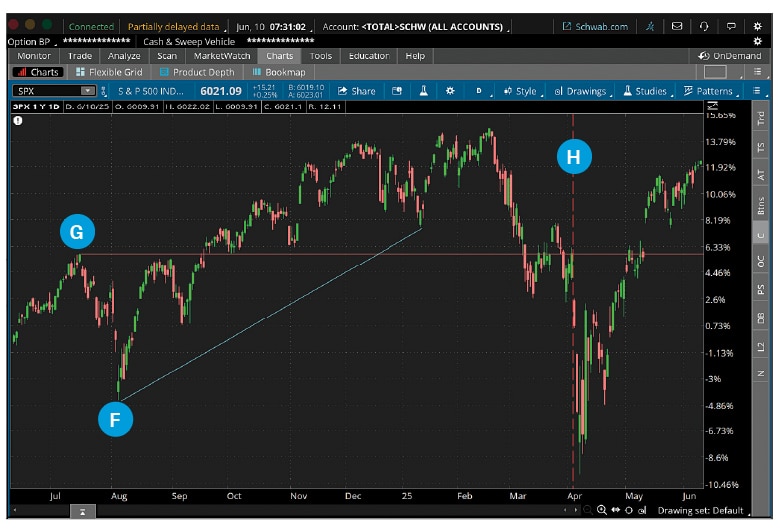
🅕 Trendline: Create a line between two selected points to visualize the slope of a trend.
- Click any two points on the chart.
🅖 Price level: Create a horizontal line at a selected price, typically used to visualize support or resistance.
- Double-click a point on the chart; the line will appear to the right of that point.
🅗 Time level: Create a vertical line on a selected date to visualize key moments or time-based patterns.
- Double-click a point on the chart.
Annotating specific details
Source: thinkorswim desktop platform.
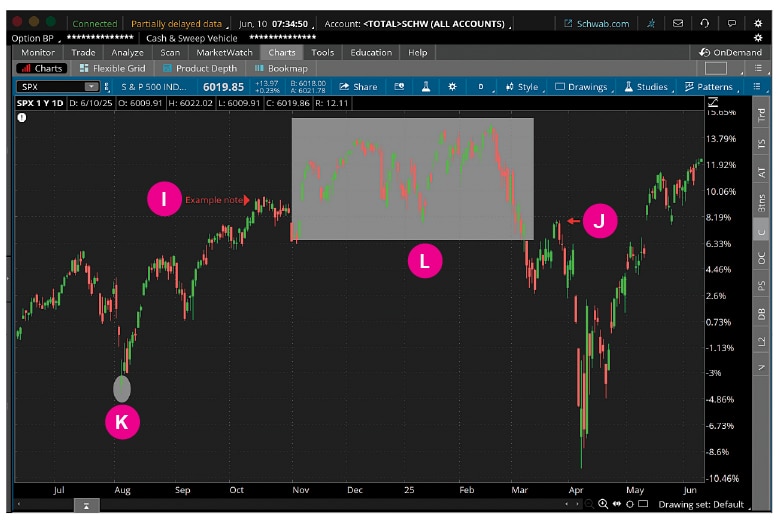
🅘 Text note: Create a note, such as to document ideas or record observations, anywhere in the chart or at a selected point.
- Click on the chart. Enter text in the pop-up box, then click OK.
🅙 Arrow: Create an arrow at the selected point to highlight potential trend reversals or specific price movements.
- Click a point on the chart. To change the direction of the arrow, right-click, move your cursor over Direction, then make a selection.
🅚 Oval: Create an oval at the selected point to highlight potential entry or exit points.
- Click a point on the chart, move the crosshair (cursor) to expand the oval to the desired size, then click again to lock the size.
🅛 Rectangle: Create a rectangle at the selected point to highlight where a chart pattern has formed.
- Click a point on the chart, move the crosshair (cursor) to expand the rectangle to the desired size, then click again to lock the size.
Adjusting drawings
As with most features on the thinkorswim platform, you can adjust your drawings according to your preferences:
- Change a drawing's appearance: Right-click on the drawing and select Edit properties, which will allow you to name it and adjust values, as well as customize its color or size. For example, we've changed the 🅕 trendline color to aqua and changed the 🅗 time level line style to dashed. You can also save any changes as the default style for future drawings.
- Reposition a drawing: Right-click on the drawing and select Activate drawing, which will turn it blue, indicating it's in editing mode. Move it to your desired location and click anywhere on the chart to set its new position.
- Delete a drawing: Right-click on the drawing and select Remove drawing.
- Delete all drawings: Right-click anywhere on the chart and select Clear drawing set. If you're sure you'd like to delete all drawings, click OK in the pop-up window.
Once you've created a drawing, it will remain on the chart until you remove it, allowing you to keep tabs on price patterns over time.
Find more tutorials for getting the most out of thinkorswim trading platforms.
Discover more from Onward

Keep reading the latest issue online or view the print edition.