Technical Indicators: 3 Trading Traps to Avoid

As promising as a stock's price pattern may appear, it always has the potential to defy expectations. Let's look at three patterns that commonly lead traders astray—and how corroborating signals and a little patience can help keep you on track.
1. Overbought/oversold traps
What it is: Generally, a stock is considered overbought when its relative strength index (RSI)—a measure of its price's strength against its own price history on a scale of 0 to 100—surpasses 70, which may indicate a possible coming downtrend. Conversely, a stock is considered oversold when its RSI dips below 30, which may mean an uptrend is in the offing. However, stocks in a strong uptrend or downtrend can also continue to power higher or lower, tricking traders into making moves that don't pan out.
How to avoid it: In either case, it's especially important to look for corroboration from other indicators, such as support or resistance from a simple moving average.
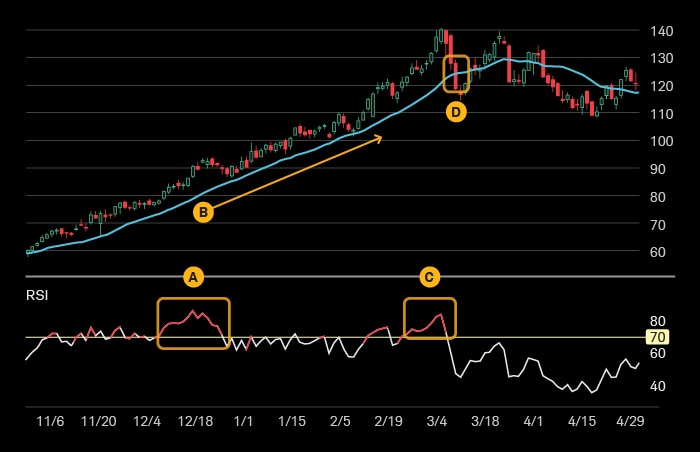
How to spot an overbought trap

Source: thinkorswim platform provided by Schwab.
For illustrative purposes only.
A. The stock's RSI spikes to 85, indicating a very overbought situation.
B. However, the stock still has support from its 20-day simple moving average (SMA), indicating the trend could have legs. (A trader who sold their position based on the RSI's overbought signal alone would have missed out on quite a ride.)
C. A clearer sell signal can be seen when the stock's sharp rise in RSI . . .
D. . . . is followed by a break below the 20-day SMA.
How to spot an oversold trap

Source: thinkorswim platform provided by Schwab.
For illustrative purposes only.
A. The stock's RSI dips below 30, indicating an oversold situation.
B. However, the stock still has resistance from its 20-day SMA, indicating continued weakness. (A trader who opened a position based on the RSI's oversold signal alone would have experienced steep losses as the stock continued to struggle.)
C. A clearer buy signal can be seen when the stock's RSI breaks above 30 . . .
D. . . . and its price breaks above the 20-day SMA.
2. Bull trap
What it is: An upward-trending stock experiences what appears to be a temporary pullback, tempting traders to buy in when the price looks set to rebound. Instead, the stock resumes its descent.
How to avoid it: When a stock in a strong bullish uptrend takes a step back, that doesn't always signal another breakout. Traders may wait to see whether the upward trend resumes—perhaps holding off as long as a few trading sessions—before taking a position. If they already own the stock, they might sell when the trend is broken rather than fruitlessly wait for a rebound while potentially suffering painful losses.
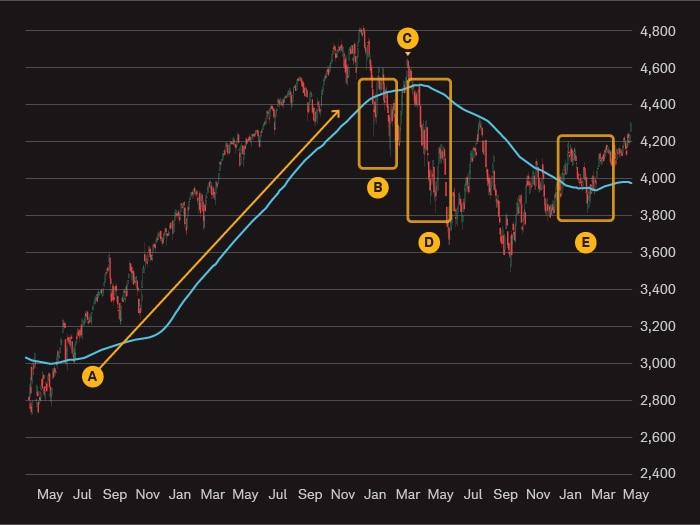
How to spot a bull trap

Source: thinkorswim platform provided by Schwab.
For illustrative purposes only.
A. The stock has been trending higher for some time, staying well above its 200-day SMA . . .
B. . . . before breaking below its SMA and making lower lows.
C. The price then moves back above the SMA, potentially indicating continuation of the uptrend.
D. However, the upward momentum is only temporary, and the price experiences even lower lows.
E. Waiting for the stock to show several days of support would be a stronger confirming signal.
3. Bear trap
What it is: A stock's price falls below a key level of support, appearing to indicate the start of a downtrend and prompting short sellers to bet against the stock. However, the pullback is temporary and the stock rebounds instead, creating losses for traders who attempted to short the stock.
How to avoid it: Prices might rise over time, so patience may be warranted if you think a bullish pattern has been broken.
As for confirming signals, if the price is making lower lows as it breaks below key lines of resistance, that could indicate the uptrend is exhausted. In this situation, many traders consider waiting until the price falls even further before placing their trades—reducing their potential profit but also their potential loss.
How to spot a bear trap

Source: thinkorswim platform provided by Schwab.
For illustrative purposes only.
A. The stock experiences three consecutive days of declines, with the price breaking below the 20-day SMA on the third day.
B. The pattern resembles the start of a downtrend earlier in the year, potentially indicating another significant move lower.
C. The price recovers quickly and resumes the uptrend.
D. Waiting for the price to make lower lows as it breaks below its 20-day SMA would be a stronger confirming signal.
Keep at it
Even the best chart readers can be wrong at times. If you're just getting started, you can practice with the paperMoney® application—a virtual trading experience that lets you hone your skills on the thinkorswim® platform using real-time market data—to increase your confidence before putting real money at stake. The more experience you have analyzing charts and their signals, the more likely you'll be able to see technical traps for what they are.
thinkorswim® paperMoney®
Learn more about testing the waters using paper trading.
Discover more from Onward

Keep reading the latest issue online or view the print edition.