Weekly Trader's Outlook
Middle East Tensions, Rising Oil & Yields Weigh on Stocks

The Week That Was
If you read last week's blog, you might recall that I had a "Cautious" outlook for the market this week, as I believed the jump in oil prices and U.S./Iran re-escalation was not being fully discounted by investors. At the time of this writing (1:34 p.m. ET) all the majors are on track to be down modestly on the week, with the tech-heavy Nasdaq Composite being the worst performer (-1.4%). The exchange of attacks between the U.S. and Iran continued this week and oil prices continued to climb higher. Last week, WTI crude jumped 14% and this week they are on track to be another 8%, and that includes today's 3.6% drop (WTI crude September futures last seen trading at $88.86/barrel). Today's pullback in crude appears to be tied to reports that Pakistan is exploring a path towards a resumption in stalled U.S./Iran negotiations. Sources stated that Iran's Interior Minister Eskandar Momeni traveled to Islamabad earlier this week to conduct exploratory discussions and met with Pakistani government leaders.
The relative weakness in tech this week was mostly driven by a post-earnings sell-off in Google-parent Alphabet on Wednesday after the bell. The company delivered strong results, highlighted by an 82% year-over-year increase in cloud revenue (vs. whisper numbers around +70-75%), but heavy capital expenditure (CapEx) guidance appears to have soured investor sentiment. Alphabet raised their 2026 CapEx guidance from $180-190B to $195-205B and said that 2027 CapEx would increase "significantly" versus 2026. Additionally, the company posted negative free cash flow (-$5.9B) in the quarter for the first time since its public debut in August 2004. While the demand for compute remains very strong, investors appear to be turned off by the potential risk associated with hyperscaler spending.
Tracking the second-quarter (Q2) earnings scorecard, the results have been very strong and the commentary around consumer behavior from the financial giants has been encouraging. So far, 133 of the S&P 500 (SPX) companies have reported results and 70% have beat estimates on the top line while 87% have beat on the bottom line. Perhaps more impressively (although it's still early in the season), earnings per share (EPS) growth is currently tracking at 69.81% and revenue growth is at 12.61%.
Outlook for Next Week
At the time of this writing (2:10 p.m.ET) stocks are mixed, and roughly near the midpoint of today's range (DJI + 269, SPX + 20, $COMP - 53, RUT + 5). On the one hand, if a resumption of stalled U.S.-Iran negotiations occurs the weekend, this would likely help oil prices come back down and would be bullish for stocks. On the other hand, U.S. President Donald Trump said he is considering a "massive attack" on Iran to push them into negotiations, and should that occur, oil prices could move back higher next week, which would likely push yields higher and be bearish for stocks. Setting the Iran conflict aside, it will be a catalyst heavy week for markets. Not only do we have a Federal Open Market Committee (FOMC) meeting on Tuesday-Wednesday, but the Bank of Japan will also be holding a monetary policy meeting. On the economic calendar we'll get the monthly Personal Consumption Expenditures (PCE) Prices report, which is the Federal Reserve's preferred inflation gauge. Then we'll get quarterly earnings reports from four of the "Mag 7" – Amazon, Apple, Meta and Microsoft. From what I can see, analysts are expecting increased CapEx guidance from AMZN, META and MSFT, and if this week's post-earnings reaction to Alphabet's CapEx guidance is an indicator of investor's mood around heavy spending, there could be some risk around these reports. Regarding the technical outlook, the SPX dropped below its 50-day simple moving average (SMA) over the past 48 hours and the Nasdaq Composite is trading below near-term support around 25,000 at the time of this writing (24,975), which is not bullish. Therefore, I'm going to provide an overall "Moderately Bearish" forecast for stocks next week, with a secondary expectation for "Higher Volatility" given all the potential catalysts. What could challenge my outlook? If the U.S. and Iran announce a ceasefire or if there is de-escalation, this will like bring oil prices and yields down and subsequently provide a lift to stocks.
Other Potential Market-Moving Catalysts
Economic:
- Monday (July 27): Durable Orders
- Tuesday (July 28): Advanced International Trade in Goods, Advanced Retail Inventories, Advanced Wholesale Inventories, Consumer Confidence, FHFA Housing Price Index, S&P Case-Shiller Home Price Index
- Wednesday (July 29): FOMC Decision, EIA Crude Oil Inventories, MBA Mortgage Applications Index
- July 30th – 31st: Bank of Japan (BOJ) Monetary Policy Meeting
- Thursday (July 30): Continuing Claims, EIA Natural Gas Inventories, Q2 GDP – Advanced Reading, Initial Claims, PCE Prices, Personal Income, Personal Spending
- Friday (July 31): Chicago PMI, Employment Cost Index, University of Michigan Consumer Sentiment
Earnings:
- Monday (July 27): Alliance Resource Partners LP (ARLP), Bank of Hawaii Corp. (BOH), Brown & Brown Inc. (CRO), Cadence Design Systems Inc. (CDNS), Celestica Inc. (CLS), Coca-Cola Femsa SAB de CV, Dyne Therapeutics Inc. (DYN), F5 Inc. (FFIV), Nucor Corp. (NUE), Principal Financial Group Inc. (PFG), Welltower Inc. (WELL)
- Tuesday (July 28): American Tower Corp. (AMT), Barclays PLC (BCS), Bloom Energy Inc. Boeing Co. (BA), Coca-Cola Co. (KO), Corning Inc. (GLW), Electronic Arts Inc. (EA), Ford Motor Co. (F), GSK PLC (GSK), Illinois Tool Works Inc. (ITW), KLA Corp. (KLAC), S&P Global Inc. (SPGI), Seagate Technology Holding PLC (STX), Sherwin-Williams Co. (SHW), Teradyne Inc. (TER), United Parcel Service Inc. (UPS), Visa Inc. (V)
- Wednesday (July 29): Amphenol Corp. (APH), AON PLC (AON), Arm Holding PLC (ARM), Automatic Data Processing Inc. (ADP), Boston Scientific Corp. (BSX), Deutsche Bank AG (DB), General Dynamics Corp. (GD), Johnson Controls International PLC (JCI), Lam Research Crop. (LRCX), Meta Platforms (META), Microsoft Corp. (MSFT), Qualcomm Inc. (QCOM), Starbucks Corp. (SBUX), UBS Group AG (UBS), Vertiv Holdings Co. (VRT)
- Thursday (July 30): Amazon.com Inc. (AMZN), Anheuser-Busch InBev SA (BUD), Apple Inc. (AAPL), Bristol-Myers Squibb Co. (BMY), Coinbase Global Inc. (COIN), Corteva Inc. (CTVA), Live Nation Entertainment Inc. (LYV), Mastercard Inc. (MA), Monolithic Power Systems Inc. (MPWR), Quanta Services Inc. (PWR), Shell PLC (SHEL), Stryker Corp. (SYK), Trane Technologies PLC (TT), Vale SA (VALE)
- Friday (July 31): Abbvie Inc. (ABBV), Chevron Corp. (CVX), Colgate-Palmolive Co. (CL), Dominion Energy Inc. (D), Eaton Corp. (ETN), Enbridge Inc. (ENB), Linde PLC (LIN), Natwest Group PLC (NWG)
Economic Data, Rates & the Fed
The economic calendar was exceptionally light this week, which was highlighted by the S&P Global Purchasing Managers' Index (PMI) readings and weekly initial claims. The standouts for this week were an eight-month high in the S&P Global Services PMI and a sharp drop in Initial Jobless Claims to the lowest levels since 1969. Here's a breakdown of the reports:
- Leading Economic Index: -0.2% vs. 0.2%.
- New Home Sales: 628K vs. 620K est.
- S&P Global U.S. Manufacturing PMI: This manufacturing index ticked down to 53.8 from 53.9, which was below the 54.3 economists expected.
- S&P Global U.S. Services PMI: This services index rose to 53.6 in July from 51.2 in the prior month, which represents the highest level in eight months.
- EIA Crude Oil Inventories: +2.01M barrels.
- EIA Natural Gas Inventories: +32 bcf.
- Initial Jobless Claims: Initial applications for U.S. jobless benefits decreased 22K from last week's (upwardly revised) 209K to 187K, which is the lowest level since 1969 and below the 212K economists were expecting. Continuing Claims dropped by 2K from the (downwardly revised) prior week to a seasonally adjusted 1.796M.
- The Atlanta Fed's GDPNow "nowcast" for Q2 GDP is unchanged from last week at 1.7%.
U.S. Treasuries increased across the board this week, which was driven by the U.S./Iran escalation in hostilities and this week's ~8% rise in oil prices. Compared to last Friday, two-year Treasury yields are up ~10 basis points to the highest levels since December 2024 (4.311% vs. 4.2158%), 10-year yields jumped ~17 basis points (4.714% vs. 4.545%) while 30-year yields are higher by ~7 basis points (5.137% vs. 5.06%).
Market expectations around a potential rate hike from the Federal Reserve jumped this week, primarily driven by the rising Middle East tensions and subsequent ~8% rise in oil prices. Per Bloomberg, the probability of a Fed rate hike at the July FOMC is up to 31% from 13% and the first theoretical 100% probability of a rate hike has been pulled forward from December to the September FOMC (vs. 68% last week).
Technical Take
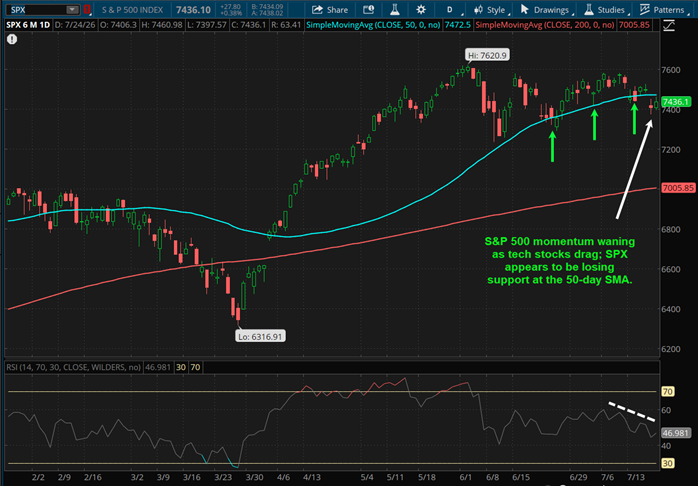
S&P 500 Index (SPX + 28 to 7,436)
The S&P 500 (SPX) is on track to be down modestly this week, but has been holding up well, relative to this week's pullback in tech. The reason is because when money rotates out of tech, it finds its way into other sectors, such as financials and healthcare, which is holding the index level up. However, the SPX fell below its 50-day SMA yesterday and is below this intermediate-term indicator today, which has provided some level of support over the past month. The fate of the SPX next week will likely be determined by: a) the trajectory of oil prices/bond yields, and b) the market's reaction to mega-cap tech earnings. From a near-term technical perspective however, since momentum is waning and the index is below the 50-day SMA I'm providing a slightly bearish outlook.
Near-term technical translation: slightly bearish
Source: ThinkorSwim trading platform
Past performance is no guarantee of future results.
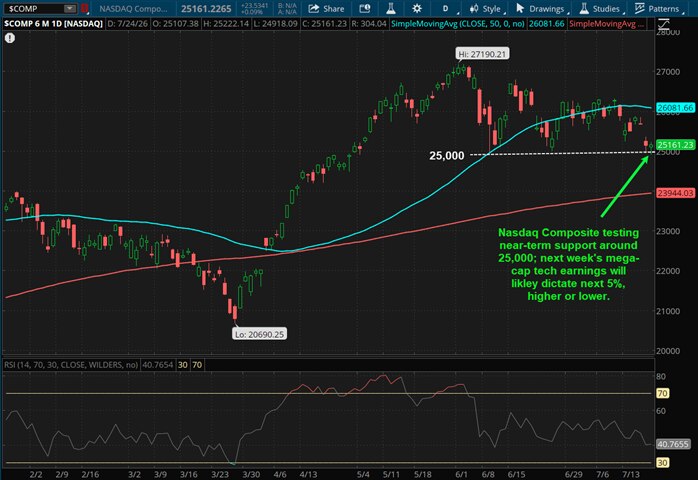
Nasdaq Composite Index ($COMP + 24 to 25,161)
The Nasdaq Composite index ($COMP) is on track to be down roughly 1.4% this week, which has taken the index down near-term support around 25,000. The $COMP bounced off this level back on June 9th, and then again on June 26th. Today, and even yesterday, the index has found some bid support when it dips below 25,000, so the support is attempting to hold up. Generally, it's not bullish to see multiple tests on a support level over a short period of time, but since it seems to be holding up today, I'd assign a slightly bullish technical view on a near-term basis. However, the fate of the $COMP next week is likely tied to how the market reacts to earnings from (AMZN, AAPL, META, MSFT). If the post-earnings reaction is poor, and the $COMP subsequently falls, the 200-day SMA at 23,943 would be the next key support test.
Near-term technical translation: slightly bullish (since 25,000 support appears to be holding up)
Source: ThinkorSwim trading platform
Past performance is no guarantee of future results.
Cryptocurrency News
The Bitwise 10 Large Crypto Index is flat since last Friday, with bitcoin and ether also flat at the time of writing. The CLARITY Act remained in the news this week, with lawmakers working to get it passed. With the Senate officially set to go on recess on August 7th, that leaves very little time for the bill to pass, potentially delaying passage until after the midterms.
Passage of the CLARITY Act remains a key fundamental catalyst. Data suggests that changes in CLARITY Act odds of passage have not impacted bitcoin's price this year. This is important for two reasons: 1) if the bill were to get delayed, it may not impact bitcoin and the broader crypto market from a price perspective; 2) if the bill were to pass, it could reignite the institutional adoption narrative from earlier this year, potentially resulting in upside. This suggests at these levels, bitcoin offers limited legislative downside with an embedded call option should the bill pass.
A multivariate regression using CLARITY Act Odds of Passage, 10-year Yields, Oil, Nasdaq 100 price (proxy for risk appetite), Inflation Breakevens, the US Dollar, Long Bitcoin Liquidations and Short Bitcoin Liquidations suggest that nearly 35% of bitcoin's daily moves are not tied to any of these factors. Rising/falling CLARITY Act odds of passage had very little impact on bitcoin's daily price change, only explaining 4.3% of the daily change. The dollar and inflation breakevens had even less of an impact. It's important to note that long and short liquidations are not drivers of bitcoin's price but amplify the daily price swings. Without including them in the regression, nearly 60% of bitcoin's daily price changes were attributable to unspecified factors.
Clarity Act odds of passage had limited impact on bitcoin's daily price change (January – March 2026)
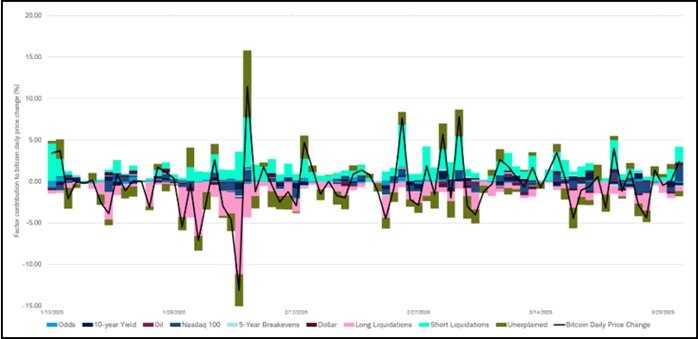
Source: Bloomberg, Glassnode, Schwab as of March 31, 2026.
Macro factors had limited impact on bitcoin's daily price change (April 2026 – Present)
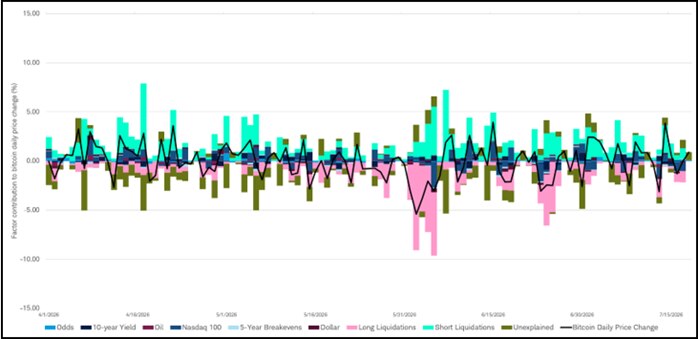
Source: Bloomberg, Glassnode, Schwab as of July 24, 2026.
This analysis offers two important takeaways. First, it reinforces that bitcoin is ultimately a low correlation asset. While certain macro factors can impact its price, those relationships are not constant. The six factors (excluding liquidations) showed that nearly 60% of bitcoin's volatility is driven by unspecified or idiosyncratic factors. Second, CLARITY Act passage is not represented in bitcoin's price.
Liquidations magnify bitcoin's daily price changes
| Factor | Average share of daily bitcoin price change |
|---|---|
| Unexplained/Idiosyncratic | 31.4% |
| Short Liquidations | 29.8% |
| Long Liquidations | 25.5% |
| Nasdaq 100 (Risk Appetite) | 5.6% |
| CLARITY Act Odds of Passage | 4.3% |
| Dollar | 1.9% |
| Oil | 0.7% |
| Breakevens | 0.5% |
| 10-Year Yield | 0.3% |
Excluding liquidations, majority of bitcoin's daily price move is unexplained by factors
| Factor | Average share of daily bitcoin price change |
|---|---|
| Unexplained/Idiosyncratic | 60.2% |
| Nasdaq 100 (Risk Appetite) | 20.5% |
| CLARITY Act Odds of Passage | 8.0% |
| Dollar | 4.0% |
| Oil | 1.0% |
| Breakevens | 2.1% |
| 10-Year Yield | 4.1% |
A final observation from the period this analysis was conducted offers a perspective on what could potentially occur if the CLARITY Act is signed into law. In early April, the institutional adoption narrative resurfaced following the launch of spot crypto trading and another spot exchange-traded product (ETP) from two well-known financial institutions. This period saw bitcoin's price rise from $66,000 to $82,000, a 25% gain over a one-month period. If the law were to pass, it could add fuel to the institutional adoption narrative, potentially offering upside in the short-term. That said, past performance is no guarantee of future results.
The launch of crypto offerings appears to have sparked a brief rally in bitcoin in early April
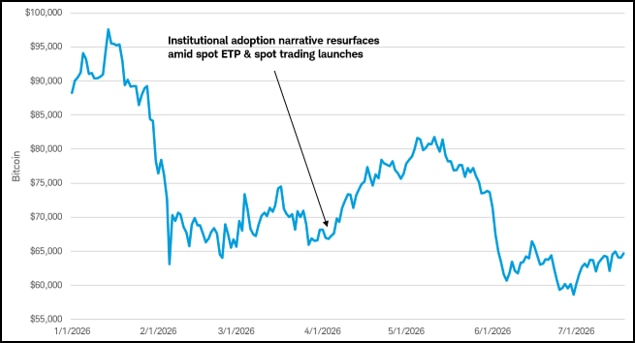
Source: Bloomberg, Schwab as of July 24, 2026.
Jim Ferraioli , Director of Digital Currencies Research and Strategy, authored this report.
Market Breadth
The Bloomberg chart below shows the current percentage of members within the S&P 500 (SPX), Nasdaq Composite (CCMP) and Russell 2000 (RTY) that are trading above their respective 200-day Simple Moving Averages (SMA). In short, market breadth on the SPX (as measured by the percentage of stocks above the 200-day SMA) is at the highest levels since December 2024, while market breadth on the Nasdaq contracted. Compared to last Friday, the SPX (white line) breadth dropped to 65.93% from 71.14%, the CCMP (blue line) fell to 43.54% vs. 46.53%, and the RUT (red line) pulled back to 63.36% versus 67.86% (all week-over-week).
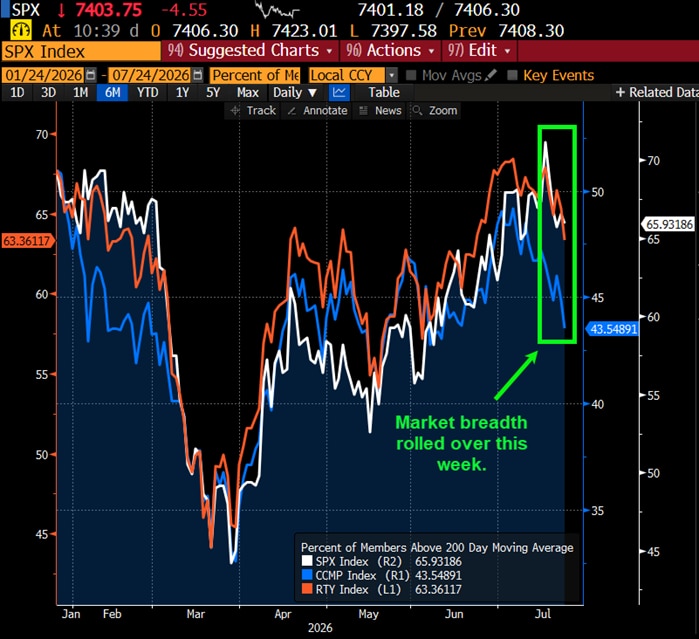
Source: Bloomberg L.P.
Market breadth attempts to capture individual stock participation within an overall index, which can help convey underlying strength or weakness of a move or trend. Typically, broader participation suggests healthy investor sentiment and supportive technicals. There are many data points to help convey market breadth, such as advancing vs. declining issues, percentage of stocks within an index that are above or below a longer-term moving average, or new highs vs. new lows.
This Week's Notable 52-week Highs (46 today): Allstate Corp. (ALL + $4.23 to $258.75), International Seaways Inc. (INSW + $1.47 to $92.81), Ovintiv Inc. (OVV + $2.43 to $63.82), Plains All American Pipeline LP (PAA - $2.17 to $340.98), Targa Resources Inc. (TRGP + $3.74 to $289.32), Wabtec Corp. (WAB + $2.78 to $300.77)
This Week's Notable 52-week Lows (74 today): Albertsons Companies Inc. (ACI - $0.37 to $10.90), Celsius Holdings Inc. (CELH - $0.54 to $26.63), Charter Communications Inc. (CHTR - $5.21 to $121.29), MP Materials Corp. (MP - $1.98 to $42.67), Oracle Corp. (ORCL - $3.74 to $116.30), Quantumscape Corp. (QS - $0.27 to $4.84)