Using Implied Volatility Percentiles
When trading options, you're likely to see a lot of price changes. The magnitude and direction of these changes aren't constant, though, making it challenging to track these changes. Another challenge is differentiating a "normal" change versus the "not-so-normal" kind?
Relative index performance
One way to track changes is to compare the S&P 500® Index (SPX) and the Cboe Volatility Index® (VIX), which many traders believe are inversely related. When the SPX is in rallying mode, the VIX tends to be low. And when the SPX is pulling back, the VIX tends to move higher.
Theoretically, an ultrahigh VIX might indicate an SPX bottom is near, and an ultralow VIX might indicate market exuberance or complacency. Of course, it's good to remember these relationships are only trends, and markets can move in unpredictable ways. Past performance of trends does not guarantee the trend will continue in the future.
Ranking volatility for trading purposes is a little more nuanced, though. Some traders turn to the Implied Volatility (IV) Percentile and Historical Volatility (HV) Percentile readings on the Today's Options Statistics subtab on the thinkorswim® platform when making trading decisions. These indicators reflect how an underlying's current IV compares to the last year's worth of historical readings.
But first, a basic IV/HV refresher.
Implied volatility vs. historical volatility
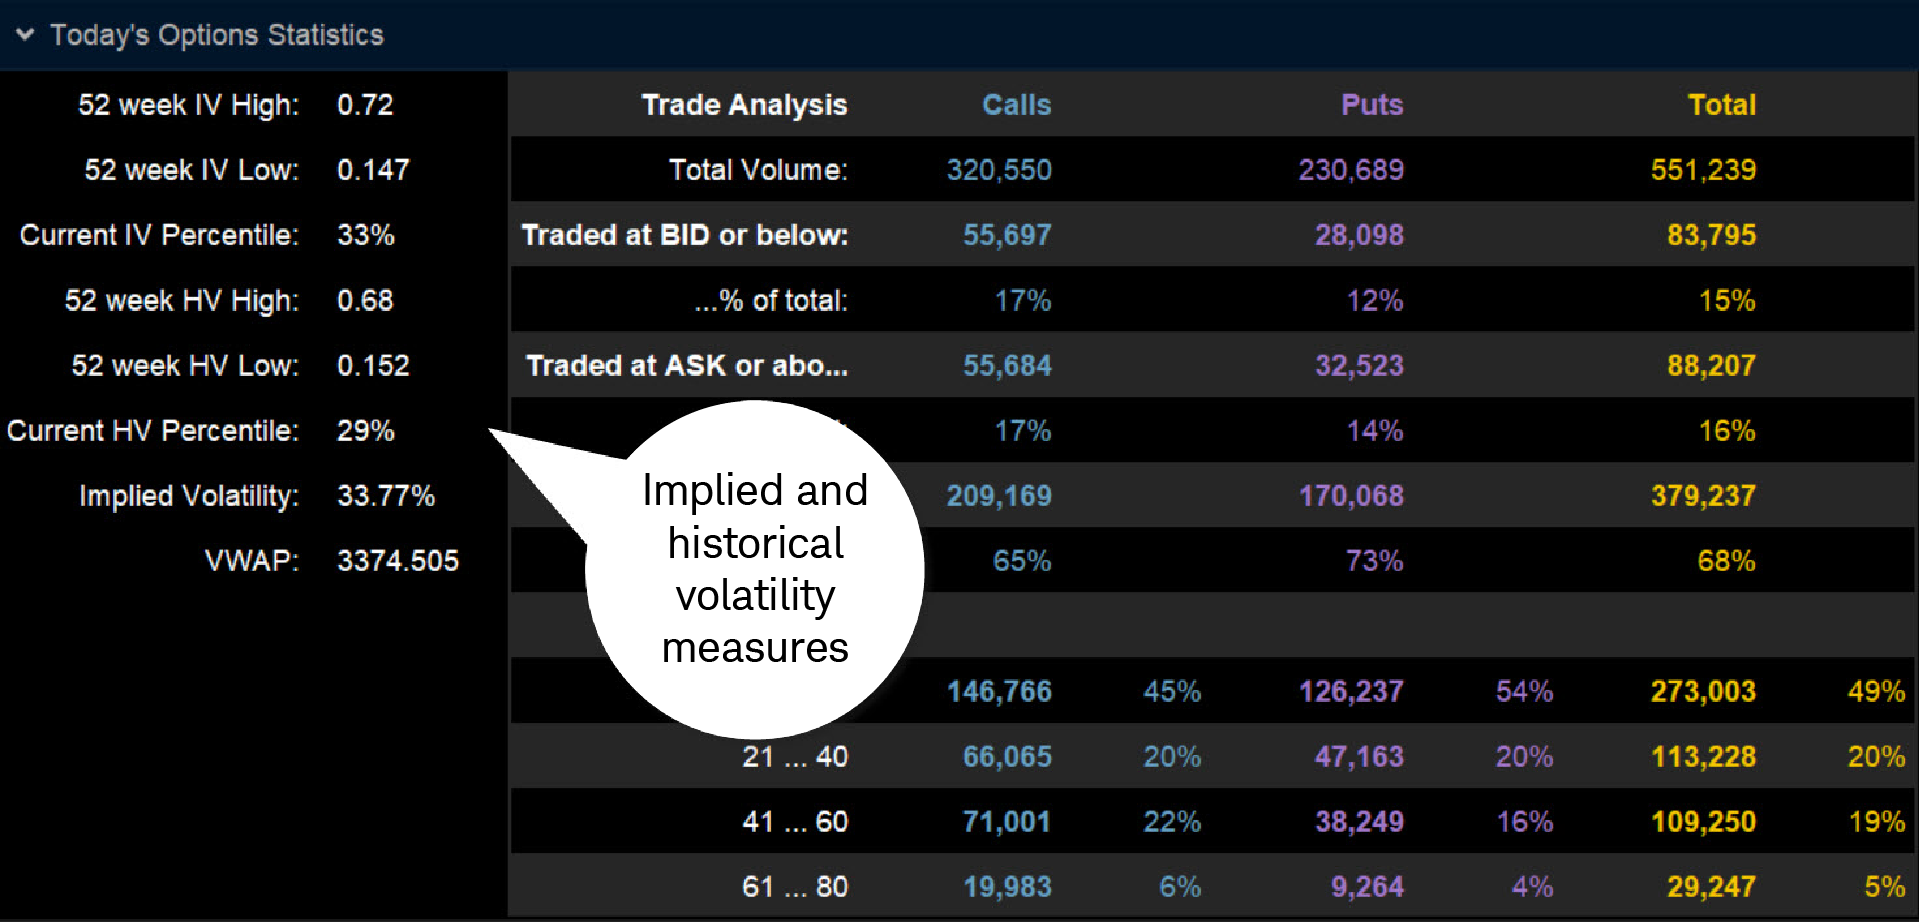
Source: thinkorswim platform
IV is calculated from the prices of currently listed options and expressed in annualized terms. The IV percentile can range from near zero to near 100%. For example, the stock in the image above shows an implied volatility of 33.77%. This means the options market is essentially pricing in variability of about 34% above or below the current price on an annualized basis.
Other data on the page can help put it in perspective:
- 52-Week IV High/Low. Over the last year, the stock in the image above has seen IV as high as 72% and as low as 14.7%.
- Current IV Percentile. Sometimes referred to as the implied volatility rank (IVR), this reading of 33% indicates that the stock's current IV is within the lowest one-third of all IV readings from the last 52 weeks.
Trading with the IV percentile
For option traders, volatility measures can be important when selecting a trading strategy. For example, a high IV percentile might indicate options premiums are relatively high, and there may be opportunities to use short options strategies like short vertical spreads, covered calls, or cash-secured puts. A low IV percentile might indicate options premiums are relatively low, and there may be opportunities to use long options strategies like calendar spreads or long vertical spreads.
Regardless of which products you trade or how often you trade them, options statistics can help you track volatility, evaluate current metrics as they relate to historical action, and make more informed trading decisions.