Fed Holds Rates Steady but Warns of Rising Risks

As widely expected, the Federal Reserve Open Market Committee (FOMC) decided to hold its policy rate steady at today's meeting. The target range for the federal funds rate—the rate that banks charge each other for overnight loans—remains at 4.25% to 4.5%. There was no change to its balance sheet policy.
The statement accompanying the policy announcement emphasized that the risks to inflation and the economy have increased since the last meeting, likely due to the highly uncertain tariff policy. Despite recent solid economic growth, the FOMC said it "judges that risks of higher unemployment and higher inflation have risen." This is an acknowledgement that the current economic outlook is a challenge to both sides of the Fed's dual mandate of maintaining policy to achieve low inflation and full employment.
Inflation and inflation expectations are too high
Inflation has been stuck in the 2.5% to 3.0% range for much of the past year. It made a lot of progress on the downside over the past two years, but with the potential for tariffs to increase costs, the trend might reverse.
Moreover, inflation expectations have risen recently in a variety of surveys. Fed Chair Jerome Powell did acknowledge the recent rise, although he noted it was mostly in expectations for the next year, but not longer term.
Inflation is still above the Fed's 2% target
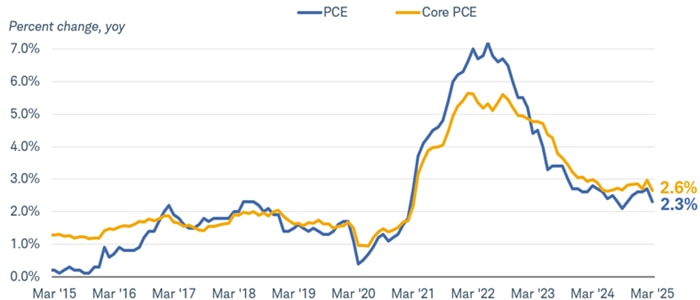
Source: Bloomberg.
Monthly data from 3/31/2015 to 3/31/2025. which is the most recent data available.
PCE: Personal Consumption Expenditures Price Index (PCE DEFY Index), Core PCE: Personal Consumption Expenditures: All Items Less Food & Energy (PCE CYOY Index), percent change, year over year.
Solid economy allows the Fed to wait
The FOMC statement indicated that the economy is in solid shape, especially the labor market. The unemployment rate is holding near 4.2% and payrolls have increased by an average of 155,000 over the past three months, which is strong enough to keep the unemployment rate low. A firm labor market reduces the urgency for the Fed to respond to slower growth.
U.S. nonfarm payrolls have held firm
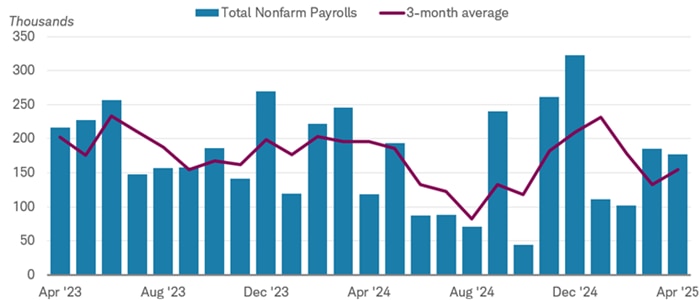
Source: Bloomberg.
Monthly data from 4/30/2023 to 4/30/2025.
U.S. Employees on Nonfarm Payrolls, Total, MoM, Net Change SA (NFP TCH Index).
Tariffs remain a point of uncertainty
The big sticking point preventing the Fed from easing policy is lack of clarity around trade policy. With the potential for tariffs to raise prices, the Fed's concern is that a temporary rise in inflation would become more persistent. Since the size and breadth of tariffs is still in flux, the Fed can't estimate what the impact will be on the economy.
Tariffs and the impact on economic growth and inflation are clearly the major concerns for businesses and consumers. Regional Federal Reserve Bank surveys have signaled broad-based worries about tariffs around the country. The recently released Beige Book, which provides the FOMC with a survey of conditions among the 12 regional Federal Reserve banks ahead of the policy meeting, included more than 100 references to tariffs by businesses.
Moreover, survey data provided by the Institute for Supply Management (ISM) on manufacturing point to the likelihood that economic growth in that sector will continue to slow while there are upward pressures on input prices. Consumer sentiment has soured, but spending has remained firm. Consequently, with inflation already above target and price increases on the horizon, the Fed doesn't have the luxury of easing even if the economy weakens. It would likely take a significant rise in the unemployment rate for the Fed to cut interest rates absent a drop in inflation.
Longer-term: Lower interest rates and a steeper yield curve
We continue to expect the Fed to cut the federal funds rate later in the year, most likely starting at the September meeting. Our outlook is for two rate cuts, but a sharper drop is possible if the economy slips into recession. Market expectations have been for three to four rate cuts this year since the announcement of tariffs in early April.
We also expect the trend toward a steeper yield curve to resume after a recent pause, as long-term rates may not decline as much as short-term rates due to concerns over inflation, rising budget deficits, and the appetite of foreign investors for U.S. Treasuries.
Expectations for Fed policy
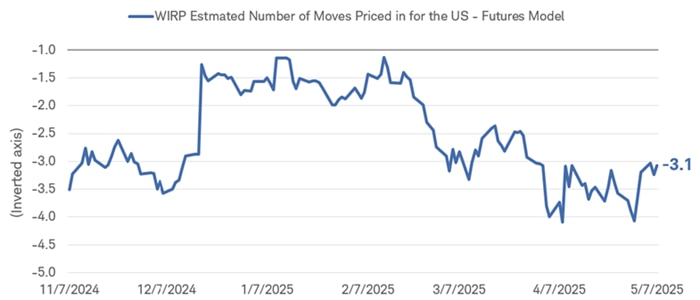
Source: Bloomberg.
Daily data from 11/7/2024 to 5/7/2025.
WIRP Implied Overnight Rate for the U.S. - Futures Model (US0ANM DEC2025 Index). The WIRP Implied Overnight Rate for the U.S. - Futures Model represents the estimated forward rate for the United States using the futures model. This ticker utilizes "virtual ticker" technology to show multiple dimensions of data via a single ticker. By default (without a virtual component added) the ticker always references data for the upcoming meeting of the country under analysis. Once a meeting passes, the ticker then rolls to the next meeting. Futures and futures options trading involves substantial risk and is not suitable for all investors. Please read the Risk Disclosure Statement for Futures and Options prior to trading futures products. Past performance is no guarantee of future results. For illustrative purposes only.
In his press conference, Powell indicated that the risks of higher inflation and weaker growth (stagflation) have increased, warranting a cautious approach to changing policy. However, he maintained his stance that the Fed doesn't need to hurry to adjust rates. We expect interest rates are likely headed lower, but the conditions to make that happen—lower inflation, and clarity about trade policy—haven't been met.