Why Invest in International Stocks

Why invest in international stocks when the United States is the world's largest economy and our stock market has the highest valuation of any in the world? The U.S. is not the only country with strong, profitable, and growth-oriented companies that can be successful investments. The car you drive, the clothes you wear, the food you eat, and the medicines your doctor prescribes are all likely to deliver profits to non-U.S. companies. You are a global consumer contributing to the profits of global companies…have you considered being a global investor, too?
You're not alone if you aren't currently investing abroad. Many investors have a "home country bias" which means they prefer – either consciously or subconsciously – to invest in companies from their home country. As humans, we like to stick with what's familiar. This behavioral tendency, while common and well documented by investment analysts, can have a negative impact on your portfolio. Geographical concentration can rachet up the risk of your portfolio, and it limits your investment opportunities since more than half the global market is located outside of the U.S.
If you're investing in stocks, international investing is worth considering. Along with diversification benefits, you may find attractive valuations and strong growth opportunities by turning your attention to the rest of the globe.
Potential benefits of adding international stocks to your portfolio
Here are some of the current market dynamics that make international stocks worth considering now:
1. More than half of the global market is abroad
Investing internationally gives you access to a bigger universe of investment opportunities, including stock in household names you know, such as Toyota, Nestle, and Samsung.
2. International markets offer the potential for sector diversification
The U.S. stock market has become heavily weighted toward information technology. As of May 30, 2025, more than 30% of the S&P 500® index was in tech. The rest of the world stock markets include more companies from the industrials and financials sectors. Adding a diversified international stock investment to your portfolio may help diversify your overall sector exposure, especially if you own lots of U.S. tech companies—either directly or via an S&P 500 index fund.
Sector Breakdown U.S. Stock Market and International Stock Market
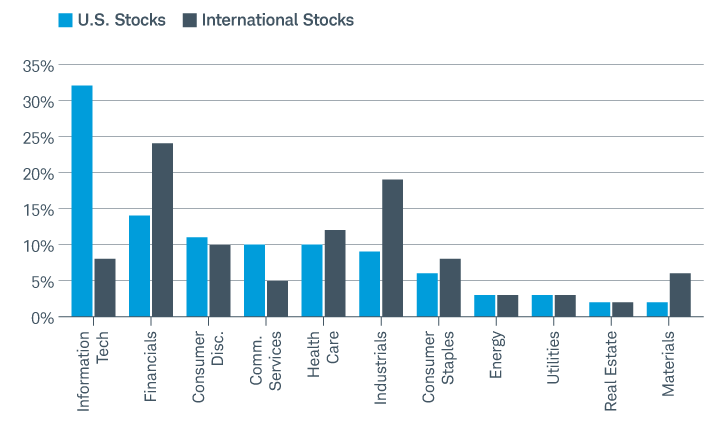
Source: S&P Dow Jones Indices LLC and MSCI, Inc.; Data as of May 30, 2025; U.S. stock market = S&P500 Index; International stock market = MSCI EAFE Index (USD)
Indexes are unmanaged, do not incur management fees, costs and expenses and cannot be invested in directly. Investing involves risk, including loss of principal.
3. International stocks have appealing valuations
Many international companies have strong, profitable balance sheets and favorable growth prospects, making them attractive investment opportunities. Stock valuations, as measured by metrics like the price-to-earnings (P/E) ratio and dividend yield, are currently more attractive for international markets, which suggests favorable future performance potential.
- U.S. stock market
- International stock market
-
Price-to-earnings ratio (P/E ratio)U.S. stock market27.99International stock market16.28
-
Trailing 12-month dividend yieldU.S. stock market1.32%International stock market2.97%
Ready to go global? Explore these investment ideas for your portfolio.
4. Currency exposure can offer diversification benefits and potentially improve returns
Buying international stocks delivers exposure to international currencies that reflect the different economic characteristics of those countries. By incorporating different currencies into an investment portfolio, investors can reduce their overall risk and potentially improve returns. This is because different currencies tend to move independently of each other, especially in relation to their respective domestic economies. Currency exposure also involves risk due to fluctuating exchange rates. Holding assets in multiple currencies helps mitigate this risk. For example, if the U.S. dollar weakens, gains in foreign currencies could help offset losses in U.S. dollar denominated investments.
5. Smaller emerging market economies are growing faster than the U.S. economy
Investing internationally offers access to fast-growing economies around the globe, including emerging markets. Emerging markets are countries that are currently experiencing rapid economic and household income growth as well as rapid industrialization. Examples include India, Brazil, South Korea, and Taiwan. Emerging markets stocks tend to be more volatile, so consider committing a small percentage of your international portfolio to this segment.
Over the past 20 years, U.S. stocks have outperformed both international developed and emerging market stocks. The outperformance has been most extreme over the last 5-10 years. Is the tide ready to turn? Get Schwab's current take on international markets here.
20-Year Historical Performance U.S. Stock Market, International Stock Market, and Emerging Markets Stock Market
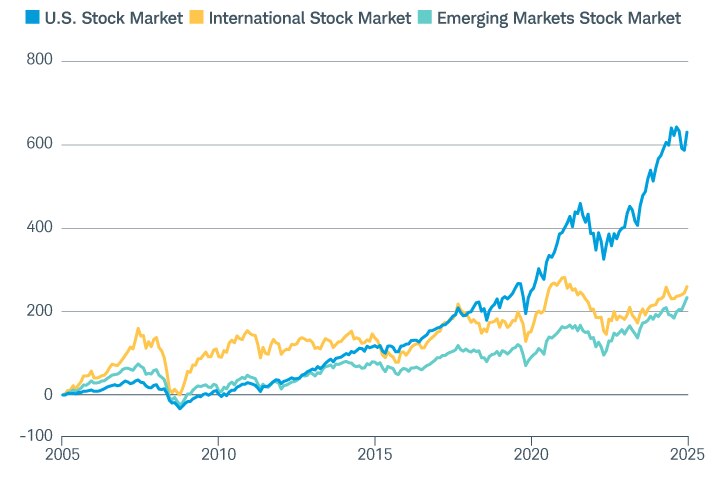
Source: Bloomberg. Data as of May 30, 2025. U.S. stock market = S&P 500 Index, International stock market = MSCI EAFE Index (USD), Emerging Markets stock market = MSCI Emerging Markets Index (USD).
Total return includes the reinvestment of dividends, interest, and other cash flows. Past performance is no guarantee of future results. Indexes are unmanaged, do not incur management fees, costs and expenses and cannot be invested in directly. Investing involves risk, including loss of principal.
Schwab's portfolios include international stocks
Schwab's portfolio construction methodology helps investors build portfolios to reflect their time horizon, risk tolerance, and goals. One of the core tenets for our methodology is global diversification, which we believe may see lower volatility over time and expanded investment opportunities for growth because it reduces concentration in one geographical region.Consider a pooled fund or SMA
For most investors, the easiest way to invest in a broad swath of international companies across countries and sectors is through an exchange-traded fund (ETF), mutual fund, or separately managed account (SMA). Funds that track a foreign market index typically are the most cost-effective, but actively managed strategies can respond to changing conditions in real time and may be more attractive to investors concerned with the risks associated with investing internationally.Bottom line on international investing
International stocks offer exposure to companies, markets, and currencies that can't be accessed through domestic investments alone. In addition, investing internationally may offer diversification benefits that could improve risk-adjusted returns. Whether buying shares in individual companies based outside the United States or choosing an index fund, there are plenty of ways to take your portfolio around the world.Check out these product ideas to start investing internationally today.