Looking to the Futures
Natural Gas Near Two-Month Low

Natural gas futures (/NG, currently set for August delivery) have been trending lower over the past two weeks. High levels of supply and healthy production have been reinforced by export limitations to put a lid on prices. The price has been subdued domestically even as prices increased for international benchmarks.
On the supply side, working gas in underground storage increased by 41 billion cubic feet (Bcf) in the week ending July 10. While the increase was slightly below injection expectations of 45 Bcf, it follows several months of healthy injection numbers. Since the beginning of April, when withdrawal season changes to injection season, storage additions totaled 1,168 Bcf, 1.3% above forecasts. Total stocks stand at 3,024 Bcf, 0.7% below last year but 6.4% above the five-year average. Injection numbers for last week are set to be released after publication of this report.
As one might expect from the numbers above, production has continued to trend higher. That has more than offset increases in domestic demand. The highest production numbers ever seen have occurred over the most recent six months, which have averaged over 133 Bcf/day. Production is slightly restricted by shipping constraints, but new pipelines are under construction and coming online. The Natural Gas Pipeline of America came online this month, adding supply to the Henry Hub where futures prices are determined. It represents a fraction of the additional 44.9 Bcf/day capacity expected to come online through the end of next year.
While domestic supply has been healthy, export capacity has been temporarily reduced thanks to downtime at a liquified natural gas (LNG) terminal on the Gulf Coast. The Freeport LNG terminal was taken offline about two weeks ago for scheduled maintenance, with operations expected to return to normal in late August. The Freeport plant, which can ship approximately 2.1 Bcf/day, is a major part of the LNG export system, which has total capacity of nearly 20 Bcf/day. In addition to the current export capacity, export plans with expected capacity of up to 24.3 Bcf/day are under construction in Texas and Louisiana. Beyond that, regulators approved plans for export plants producing up to 11.4 Bcf/day, including a major new terminal in Alaska.
The investment in export capacity is driven by the difference in price between domestic and foreign prices for natural gas. This discrepancy has been present for years, but the eruption of hostilities with Iran have increased the spread. The Strait of Hormuz, which sees the transit of nearly a fifth of all LNG trade, has been mostly closed over the past several days after the pace of attacks and counterattacks has increased. Due in large part to the disruption, East Asia prices on the Japan Korea Marker increased 10% last week and now sit at the equivalent of $21.02/MMBTU. Europe is similarly exposed, with prices at the Title Transfer Facility around $15.35/MMBTU, up over 30% since the start of the month.
Technicals
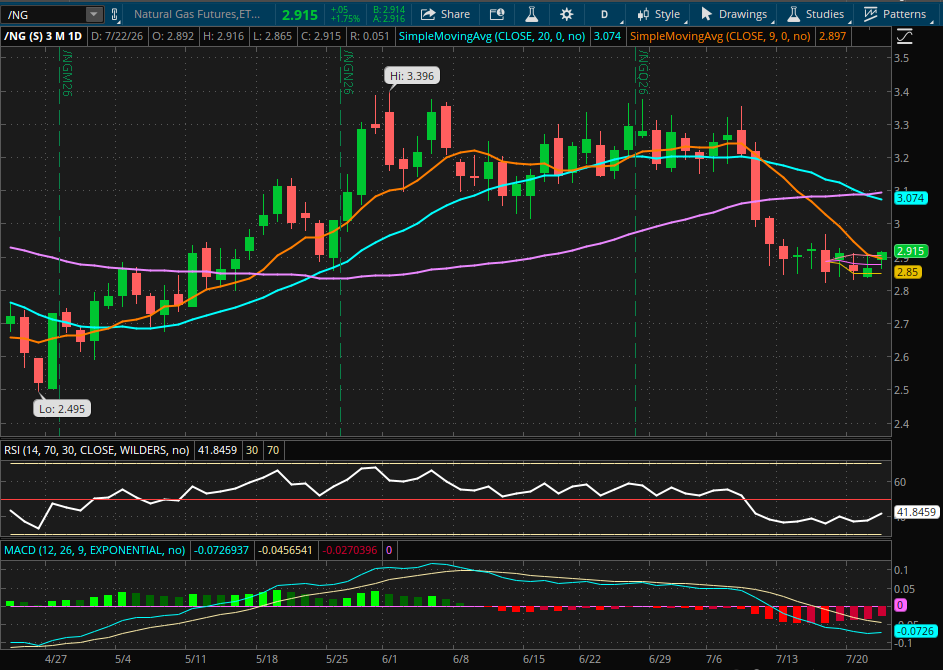
The three-month daily chart on the August contract (/NGQ26) demonstrates a range reset about two weeks ago. The contract had spent most of the prior three months between $3.05 and $3.30 before the selloff. Following that, a new range was established between $2.85 and $2.95. The decline created bearish crosses between the contract price and the 9-, 20- and 50-day SMAs. The RSI is just above oversold territory while MACD is negative but trending slightly higher.
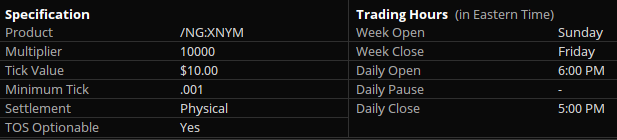
Contract Specifications
Economic Calendar
EIA Crude Oil Inventories 10:30 AM ET
MBA Mortgage Applications Index 7:00 AM ET
New Products
New futures products are available to trade with a futures-approved account on all thinkorswim platforms:
- Ripple (/XRP)
- Micro Ripple (/MXP)
- 100 OZ Silver (/SIC)
- 1 OZ Gold (/1OZ)
- Solana (/SOL)
- Micro Solana (/MSL)
Visit the Schwab.com Futures Markets page to explore the wide variety of futures contracts available for trading through Charles Schwab Futures and Forex LLC.