It Was a Very Good Year

It was a banner year for U.S. stocks in 2024, although the fuller story can be told under the surface of the capitalization-weighted indexes like the S&P 500. As shown below, the S&P 500 was up more than 23% in 2024, bested by both the Nasdaq (up nearly 29%) and the Nasdaq 100 (up nearly 25%). Those gains were boosted by the Magnificent 7 group of stocks (up nearly 67%) along with a handful of other mega-cap stocks (more on that below). That performance left the S&P 500 Equal Weight and the Russell 2000 index of smaller cap stocks in the dust—albeit with respectable gains of 10-11%.
Large caps boosted index returns

Source: Charles Schwab, Bloomberg, as of 12/31/2024.
Magnificent 7 represents Bloomberg Magnificent 7 Index which is an equal-dollar weighted equity benchmark consisting of a fixed basket of 7 widely traded companies (Alphabet, Amazon, Apple, Meta, Microsoft, NVIDIA, Tesla). All corporate names and market data shown above are for illustrative purposes only and are not a recommendation, offer to sell, or a solicitation of an offer to buy any security. Indexes are unmanaged, do not incur management fees, costs and expenses and cannot be invested in directly. Past performance is no guarantee of future results.
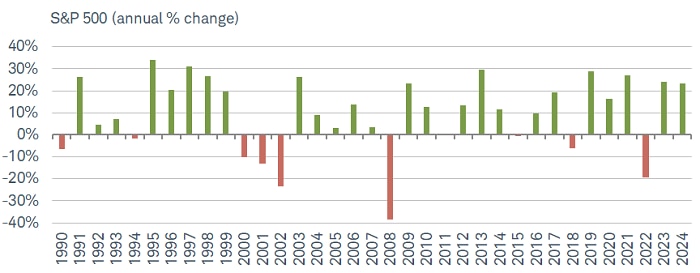
Last year was the second consecutive year with S&P 500 gains of more than 20%, as shown below; the first time that's occurred since the late-1990s.
Back-to-back >20% gains

Source: Charles Schwab, Bloomberg, as of 12/31/2024.
Indexes are unmanaged, do not incur management fees, costs and expenses and cannot be invested in directly. Past performance is no guarantee of future results.
It was the fourth year in a row with the S&P 500 outperforming the Russell 2000; with two of those years showing a spread of more than 10 percentage points, as shown below.
Large caps ruled the past four years

Source: Charles Schwab, Bloomberg, as of 12/31/2024.
Indexes are unmanaged, do not incur management fees, costs and expenses and cannot be invested in directly. Past performance is no guarantee of future results.
An old adage on Wall Street about market breadth is that the market is strongest when the soldiers, and not just the generals, are at the front line. It's on this note that one can quibble with how strong performance has been below the surface of the cap-weighted indexes. By the end of last year, the 10 largest stocks within the S&P 500 had grown to a 39% weight within the index—the second record-high (by far) set in 2024.
As shown below, for the full year 2024, only 19% of stocks within the S&P 500 outperformed the index itself. Shorter look-back time frames have improved, notably with 40% of stocks within the index having outperformed in the final four months of last year.
Paltry % of stocks outperformed

Source: Charles Schwab, Bloomberg, as of 12/31/2024.
Indexes are unmanaged, do not incur management fees, costs and expenses and cannot be invested in directly. Past performance is no guarantee of future results.
Where the fuller story is told
The table below makes it into Liz Ann's X and LinkedIn feeds nearly every morning. It shows index returns for last year, including the return from the year-to-date low and the index maximum drawdown during the year. But the final column is perhaps most interesting as it tracks the average index member maximum drawdown during the year. All three indexes actually showed bear market level declines based on that measurement. Those declines occurred throughout the year via a process of churn and rotation; while mega-cap outperformance kept the cap-weighted index returns in very healthy territory.
Fuller performance story

Source: Charles Schwab, Bloomberg, as of 12/31/2024.
Indexes are unmanaged, do not incur management fees, costs and expenses and cannot be invested in directly. Past performance is no guarantee of future results.
The bias up the cap spectrum continues to pressure active managers—especially those benchmarked against the S&P 500. But here's where a public service announcement (PSA) is warranted for individual investors, who are generally not playing the quarterly performance-against-a-benchmark game. Groups of stocks like the Mag7 and other mega-cap stocks do represent an outsized contribution to overall S&P 500 returns. However, they have not been the best price performers. Their higher contribution weight is courtesy of the multiplier of their cap size.
Only one of the Mag7 stocks—NVIDIA—was within the top-10 best S&P 500 performers in 2024, and it was second to Vistra (a Utilities stock). There were actually only two Technology stocks (NVIDIA and Broadcom) in the top 10, while there were also two Utilities stocks in the top 10, four Industrials stocks and two Energy stocks. In the case of the Nasdaq, none of the Mag7 were represented within the top-10 best performers, and none of the leaders were even large-cap stocks. Both lists are shown below.
Top 10 lists


Source: Charles Schwab, Bloomberg, as of 12/31/2024.
All corporate names and market data shown above are for illustrative purposes only and are not a recommendation, offer to sell, or a solicitation of an offer to buy any security. Sectors are based on the Global Industry Classification Standard (GICS®), an industry analysis framework developed by MSCI and S&P Dow Jones Indices to provide investors with consistent industry definitions. Indexes are unmanaged, do not incur management fees, costs and expenses and cannot be invested in directly. Past performance is no guarantee of future results.
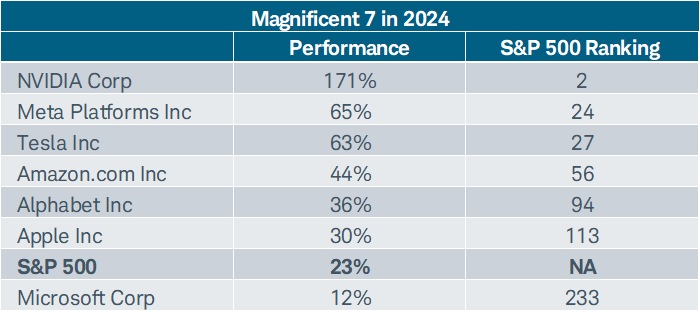
With all the attention devoted to the Mag7 group of stocks, a deeper look shows a very wide dispersion of returns, as shown below. NVIDIA topped the 2024 list with a whopping 171% return, with Microsoft bringing up the rear at only 12%—the only Mag7 stock that underperformed the S&P 500 last year.
Most magnificent

Source: Charles Schwab, Bloomberg, as of 12/31/2024.
S&P 500 ranking based on performance within the S&P 500. All corporate names and market data shown above are for illustrative purposes only and are not a recommendation, offer to sell, or a solicitation of an offer to buy any security. Indexes are unmanaged, do not incur management fees, costs and expenses and cannot be invested in directly. Past performance is no guarantee of future results.
Facts over narratives
As mentioned regarding the mega caps' contribution to the market's gain, their dominance was clear at the sector level. As you can see in the table below, Communication Services, Information Technology, and Consumer Discretionary were the top three performers. Not to be forgotten, the Financials sector was only slightly behind Consumer Discretionary, thanks to a nice bump in the second half of the year. Conversely, Materials was the only sector that declined last year, emphasizing the weak commodity theme (Energy's performance was also quite poor).
Perhaps more important, given the narratives surrounding the election and the subsequent coming change in administration, is that much of the aggressive post-election froth receded rather sharply heading into the end of the year. Looking at the middle and right columns, the only two sectors that managed to maintain their strength were Communication Services and Consumer Discretionary. Deeper cyclical areas like Industrials, Energy, and Materials saw sharp declines as the year wrapped up. As tempting as it was for investors to extrapolate the short, sharp moves in certain sectors right after the election, the past month's action has reinforced how difficult that is.
Post-election froth mostly gone

Source: Charles Schwab, Bloomberg, as of 12/31/2024.
Sectors are based on the Global Industry Classification Standard (GICS®), an industry analysis framework developed by MSCI and S&P Dow Jones Indices to provide investors with consistent industry definitions. Indexes are unmanaged, do not incur management fees, costs and expenses and cannot be invested in directly. Past performance is no guarantee of future results.
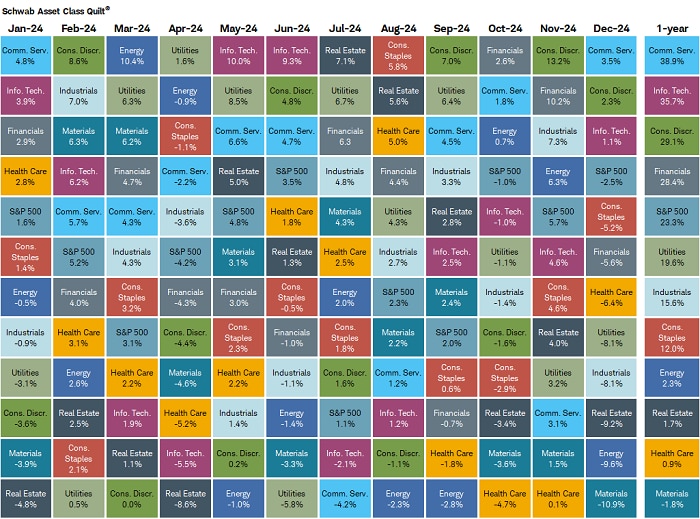
Even though the "growth trio" of Tech, Communication Services, and Consumer Discretionary dominated in terms of calendar year performance, they didn't make it through without some serious volatility. We've shown many versions of the quilt chart below, but this looks at monthly performance and rankings for 2024, with the full-year performance in the far-right column.
Rather than studying every box carefully, sometimes it's more instructive to zoom out and squint at the picture, which shows a total blend of colors, underscoring the lack of consistency when it comes to any one sector's leadership. No sector racked up more than three months being the top performer; conversely, no sector was the worst performer for a total of more than three months. As mentioned in our outlook for 2025, we expect leadership shifts to remain volatile and sharp this year—whipsawed by a macro backdrop that is largely driven by an increasing amount of Washington policy uncertainty.
2024's sector mosaic

Source: Charles Schwab, Bloomberg, as of 12/31/2024.
Sector performance is represented by price returns of the following 11 GICS sector indices: Consumer Discretionary Sector, Consumer Staples Sector, Energy Sector, Financials Sector, Health Care Sector, Industrials Sector, Information Technology Sector, Materials Sector, Real Estate Sector, Communication Services Sector, and Utilities Sector. Returns of the broad market are represented by the S&P 500. Indexes are unmanaged, do not incur management fees, costs and expenses and cannot be invested in directly. Past performance is no guarantee of future results.
That 2024, 2021, and 2017 feeling
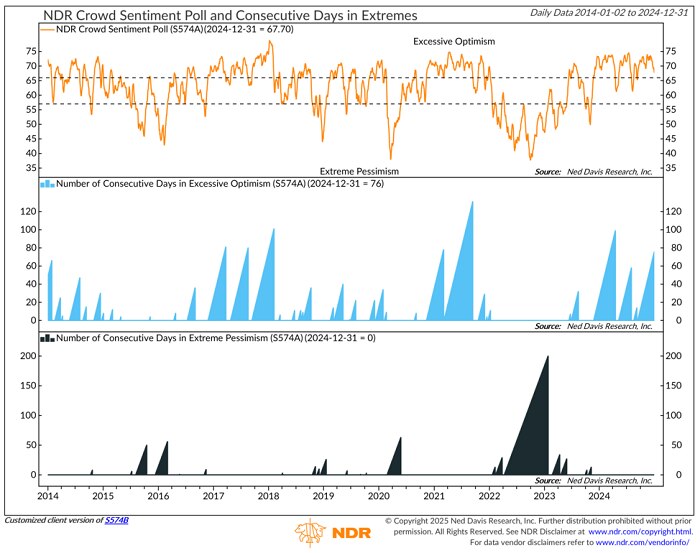
That comes at a less fortunate time for the overall market, considering the frothy sentiment environment we're coming out of. As shown in the chart below, Ned Davis Research's Crowd Sentiment Poll (CSP)—which is an amalgamation of attitudinal and behavioral indicators—ended 2024 with 76-day streak in "extreme optimism" territory.
In keeping with our maxim that frothy sentiment itself does not end bull markets, prior streaks similar or longer in duration occurred throughout 2024, yet the bull kept marching on. However, worth keeping in mind is that clusters of long streaks have been consistent with market tops in the past (e.g., 2017-2018 and 2021). As mentioned in our outlook for this year, we continue to have an optimistic outlook for stocks over a one-year time horizon, but we don't want to ignore stretched sentiment as one of the largest risks. That is even moreso the case now that the market's breadth profile has been dented over the past month.
No shortage of optimism in 2024

For illustrative purposes only.
In sum
2024 was another year of mega-cap dominance from several angles: the three sectors that house the Mag7 were the best performers; the 10 largest stocks in the S&P 500 increased their weight to nearly 40% of the index; and the only two sectors that saw positive performance following the election through the end of the year were Communication Services and Consumer Discretionary.
As we mentioned above, it's worth emphasizing that the mega caps' dominance from a size perspective isn't consistent with dominant price performance. There were hundreds of stocks that outperformed the third-largest Tech stock (Microsoft) last year; there were 112 stocks that outperformed the largest stock in the S&P 500 (Apple). Individual investors who don't "need" to measure their performance against a benchmark should take statistics like that to heart. As long as the "average stock" in an index is advancing, the market's health should remain in check. Despite that, though, we continue to think the risk of a larger pullback would grow if breadth deteriorated further (as of this writing, only 56% of S&P 500 members were above their 200-day moving average), given the frothy sentiment environment that persisted throughout 2024.