Fixed Income Market: Anchor in a Stormy Sea

Key takeaways
- Bond market volatility has remained low despite economic and policy uncertainty. Our base case is that most fixed income investments seem likely to deliver solid returns this year, in line with their starting yields, but if volatility picks up from the current low levels, investors may have to ride out some ups and downs to earn those yields.
- We continue to see a steeper yield curve as the dominant trend in the bond market in 2026. A focus on intermediate-term duration can help balance inflation and policy risks.
- A growing economy suggests that taking moderate credit risk is appropriate.
- International bonds can make sense for diversification if the dollar continues to trend lower.
The bond market has been remarkably calm in a world of rapidly changing economic policies, international conflicts, and heightened concerns about changes at the Federal Reserve. Treasury market volatility, as measured by the ICE BofA U.S. Bond Market Option Volatility Estimate (MOVE) Index, has been falling over the past year and now sits near its lowest level since 2021. While occasional bouts of volatility are likely, we expect the fixed income markets to remain a ballast for portfolios and it seems likely that they deliver solid returns in 2026.
ICE BofA Move Index
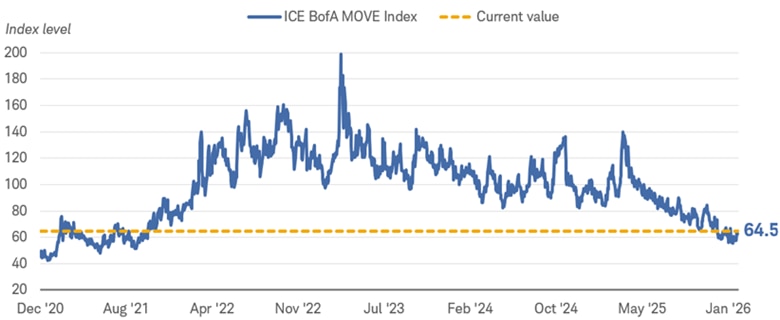
Source: Bloomberg, daily data from 12/31/2020 to 2/5/2026.
The ICE BofA (MOVE) Index is a yield-curve-weighted index of the normalized implied volatility on 1-month Treasury options. Indexes are unmanaged, do not incur management fees, costs, and expenses and cannot be invested in directly. Past performance is no guarantee of future results. For illustrative purposes only.
The major discernible trend in the fixed income market has been a steady steepening of the yield curve. Short-term yields remain anchored due to expectations for further Federal Reserve interest rate cuts while long-term yields have edged higher in response to resilient economic data, stubbornly high inflation, growing worries about financing costs of the federal deficit and rising global yields. Two-year Treasury yields, which can be viewed as a proxy for expectations for the federal funds rate a year from now, are holding near 3.5%. The yield spread between two- and 10-year Treasuries stands near 70 basis points, or 0.7%, the highest level in four years.
The yield curve has steepened as the spread between 2- and 10-year Treasuries widened
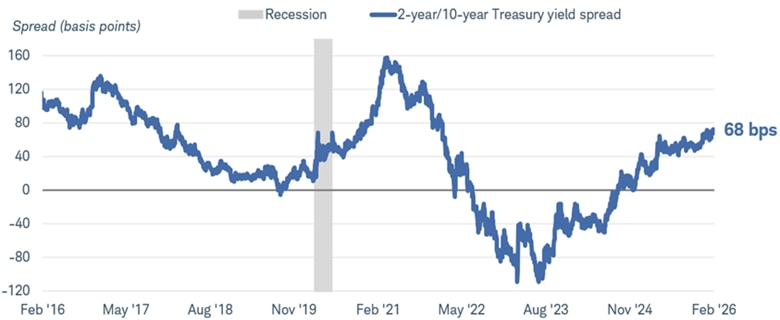
Source: Bloomberg. Daily data from 2/6/2016 to 2/6/2026.
Market Matrix US Sell 2 Year & Buy 10 Year Bond Yield Spread (USCY2Y10 INDEX). The rates are comprised of Market Matrix U.S. Generic spread rates. This spread is a calculated Bloomberg yield spread that replicates selling the current 2-year U.S. Treasury Note and buying the current 10-year U.S. Treasury Note, then factoring the differences by 100. Past performance is no guarantee of future results. For illustrative purposes only.
We see room for the curve to steepen further. The forces driving long-term yields higher appear likely to continue. Fiscal stimulus from the One Big Beautiful Bill Act, inflation pressure from the dollar's decline, and rising global bond yields are likely to keep long-term yields near 4.25%, with risks tilted toward modestly higher yields. Meanwhile, the recent nomination of Kevin Warsh for chair of the Federal Reserve Board of Governors suggests a continued bias toward lower short-term interest rates.
We expect the Fed to lower its benchmark interest rate one or two times this year, with the next cut likely not coming until this summer. Investors holding short-term investments like Treasury bills, short-term certificates of deposit (CDs) or money market funds, should be cognizant that Fed rate cuts usually result in reinvestment risk, or the risk that the yields offered later this year for short-term investments will be lower than they are now.
There's a risk to having too many long-term bonds, as well, as their prices are more sensitive to changes in bond yields. With risks to long-term yields tilted to the upside, we don't suggest investors take too much interest rate risk.
For the average investor, we favor maintaining an intermediate-term average duration to reduce exposure to the risk of rising yields at the long end of the yield curve, while limiting reinvestment risk. The Bloomberg US Aggregate Intermediate Bond Index currently has a yield-to-worst of about 4.2% and an average duration of roughly 4.3 years. For investors with a higher risk tolerance, adding some high-yield bonds and/or preferred securities in moderation could boost the income component and total return. The relative yields they offer above comparable Treasuries are low by historical standards, but those low "spreads" are likely the result of the resilient economy and rising corporate profits. High-yield bonds and preferred securities tend to be more volatile than higher-rated investments, so investors should be prepared to ride out some volatility to earn those higher yields they currently offer.
International developed market bonds, which delivered relatively high returns last year, may be appropriate for diversification purposes, but we expect lower returns this year. Most of the gain in international developed-market bonds in 2025 was due to the drop in the dollar—and subsequent rise in local currencies—along with central banks cutting short-term interest rates. In 2026, the dollar may continue to drop but we do not expect as steep a decline as last year. In addition, we don't look for foreign central banks to cut rates as aggressively, so price appreciation is likely to be less than last year.
Moreover, the rise in Japanese government bond yields is a significant factor to watch. After decades of keeping interest rates near zero and suppressing bond yields, the Bank of Japan has shifted gears in the past few years. As large net buyers of foreign bonds, Japanese investors can now find attractive yields domestically, potentially reducing demand for U.S. Treasuries and other developed-market bonds. With the anchor of Japanese bond yields lifting, yields in other markets are moving up as well. A continuation of that trend could pull long-term U.S. yields a bit higher.
Select G7 bond yields
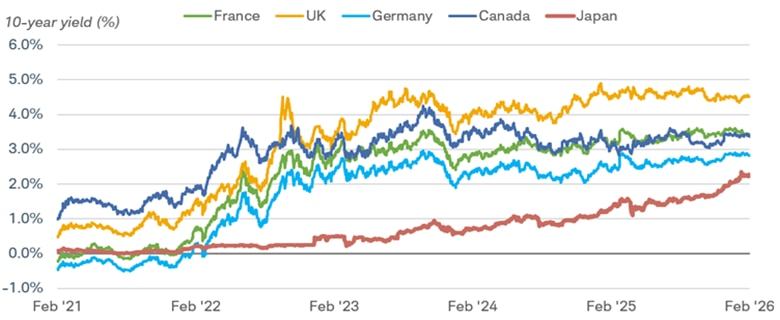
Source: Bloomberg Data from 2/6/2021 to 2/6/2026.
Past performance is no guarantee of future results.
Global 10-year Generic Govt bond yields. France (GTFRF10Y Govt), U.K (GTGBP10Y), Germany (GTDEM10Y Govt), Japan (GTJPY10Y Govt), Canada (GTCAD10Y Govt).
What investors can consider now
We continue to favor intermediate-term maturities—generally meaning average maturities in the four- to 10-year range—given our outlook for a steeper yield curve. Focusing too much on short-term investments introduces reinvestment risk based on our outlook for a rate cut or two later this year, while focusing too much on long-term investments means high interest-rate risk if yields rise due to sticky inflation or the increase in supply.
Higher-rated bond investments still appear attractive, with many yields currently at levels not generally seen from 2009 through early 2022. Treasuries, agency mortgage-backed securities, and investment-grade municipal and corporate bonds would fall under that umbrella. A growing economy suggests that taking some credit risk is appropriate for investors willing to ride out some ups and downs. For those willing to take a little risk, we favor preferred securities and high-yield bonds. International bonds can make sense for diversification if the dollar continues to trend lower.