Can AI Continue to Drive Emerging Market Stocks?

Key takeaways:
- The Iran war and resulting energy shock introduced both growth risks and inflation pressure, disrupting the supportive environment for emerging market (EM) economies. However, EM stocks have rebounded to new highs. Despite some industry-specific growth opportunities, we believe it's not the time to be overweight EM.
- Market performance has tended to favor a narrow set of sectors and companies. Although the MSCI Emerging Market Index is expected to show rapid earnings growth in 2026, it seems to be attributable to an outsized impact of a few semiconductor companies.
- The growth in use and buildout of artificial intelligence (AI) infrastructure could continue to drive earnings, but there are market and economic slowdown risks associated with dependence on the performance of a narrow group of companies.
The supportive investment environment for international stocks that developed over the back half of 2025 has been disrupted by the conflict in the Middle East. As opposed to a broadening out of economic activity and market performance, global equity market performance has narrowed around a highly concentrated set of industries and companies. With limited visibility on the timing of resolution to the energy shock emanating from the war in Iran, we suggest prudence, remaining close to strategic portfolio allocations rather than attempting to chase markets or headlines.
The Iran war disrupted the economic environment
The global economy had been gaining momentum through the back half of 2025 and into the first quarter of this year supported by the lagged impact of rate cuts, fiscal stimulus, rising capital expenditures, and improving sentiment relative to the uncertainty that characterized the first half of 2025. In addition, global financial conditions were loosening with the decline in the U.S. dollar.
However, the global energy supply shock brought on by the Iran war and the effective closing of traffic through the Strait of Hormuz could increase inflation and reduce global economic growth in 2026. Emerging markets are particularly vulnerable to a global slowdown due to their dependence on exports. In March, as it became clear that the Iran war would likely drag on and result in compounded impacts of energy and other commodity shortages, we reduced our More Preferred stance to Neutral on both developed and emerging market equities.
The full impact of the war on global economic activity has yet to be felt, due to the delayed effects of energy disruption as well as various policy interventions to mute the impacts of higher energy prices, such as releases from strategic petroleum reserves and temporary easing of sanctions on Iranian and Russian oil at sea, among others according to AP News. Emerging Market Purchasing Manager Indices (PMIs) have dropped in recent months but remain in expansionary territory (above 50), supported by inventory building ahead of expected price increases and anticipated supply shortages according to S&P Global. The decline in new orders in the chart below suggests that output may slow in coming months.
New orders have slowed
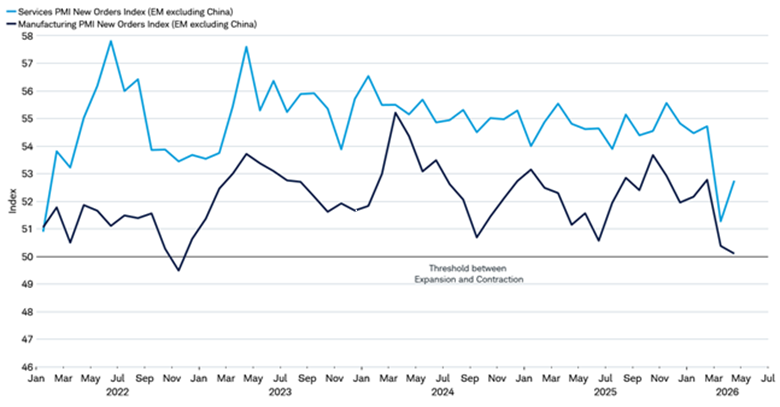
Source: Charles Schwab, S&P Global, Macrobond, as of 5/6/2026.
For illustrative purposes only.
Inflation is increasing globally but remains below the pace of the 2022 post-pandemic demand recovery and energy supply disruption from the war in Ukraine, as seen in the chart below. However, the lagged impacts of higher energy prices could have a greater effect on growth and inflation in coming months, particularly the longer it takes to resolve the energy supply shortage.
Inflation has increased
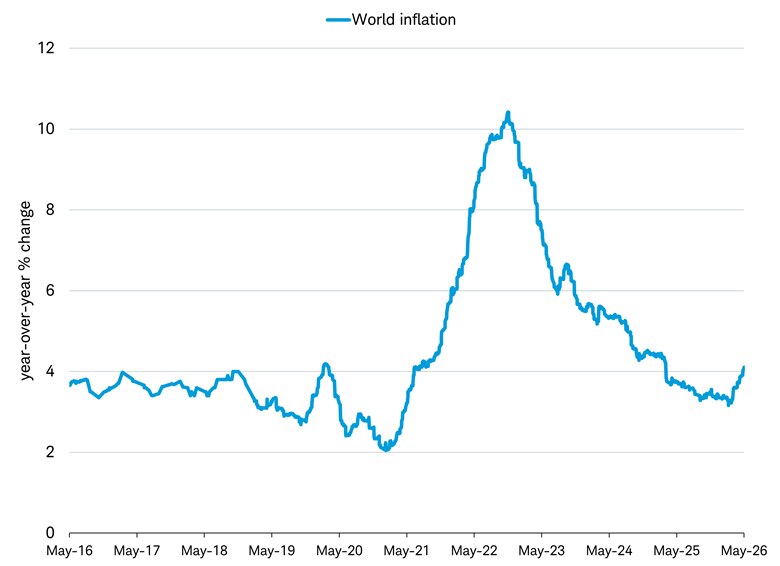
Source: Charles Schwab, Bloomberg, as of 5/6/2026.
Calculation is based on the most recent consumer price index (CPI) year-over-year reading for each country and its corresponding weight in global GDP on a purchasing power basis, as provided by the International Monetary Fund. CPI for more than 98% of the global economy is covered.
Stock leadership concentrated on semiconductor and energy companies
Despite the potential inflation increases globally in coming months, manufacturing and export demand from companies tied to the AI infrastructure buildout, or where there are shortages related to events in Iran, continue to be strong. Currently, investors seem to be chasing these areas of the market due to their earnings momentum: global energy, materials, and semiconductor companies.
The MSCI Emerging Markets (EM) Index has large weights in these sectors and industries, which means that the concentrated trend shows up in the return and earnings expectations for the index. The total return of the MSCI EM Index is up 18% in U.S. dollars this year through May 5, according to Bloomberg. FactSet reported the 2026 consensus earnings estimates for the MSCI EM Index have also increased from 18% growth at the start of the year to 36% as of May 1. The large jump in earnings estimates for this year stands out relative to prior years; estimates have generally trended lower as the year progresses, as you can see in the chart below.
Earnings for 2026 have jumped higher
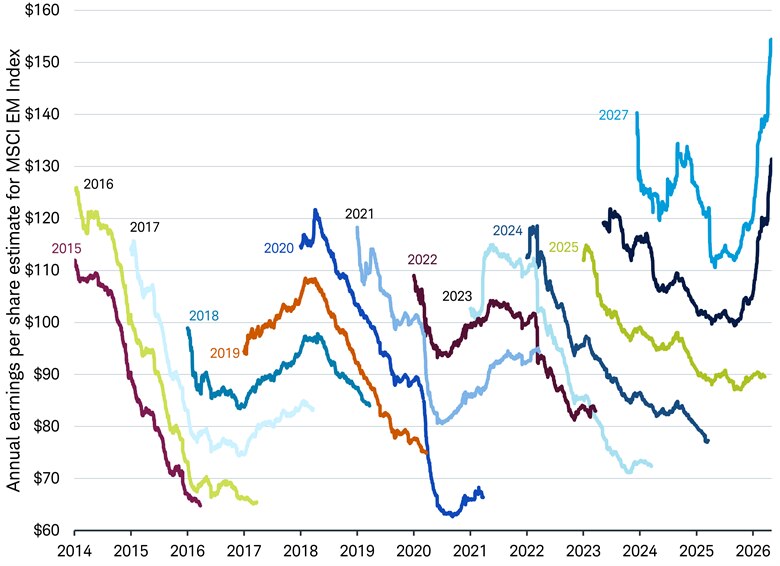
Source: Charles Schwab, MSCI and Bloomberg data as of 4/30/2026.
Forecasts contained herein are for illustrative purposes only, may be based upon proprietary research and are developed through analysis of historical public data.
Despite the increase at the aggregate level, earnings for most companies within the MSCI EM Index have been revised down throughout this year. According to MSCI and Bloomberg, the number of downward revisions have outpaced upward revisions by 10%, as seen in the chart.
More companies are seeing downward earnings revisions than upward
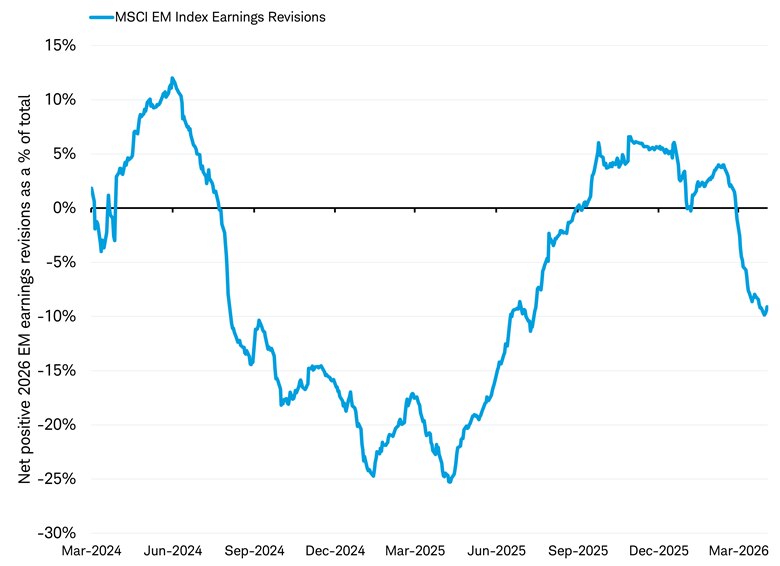
Source: Charles Schwab, FactSet, MSCI data as of 4/30/2026.
Indexes are unmanaged, do not incur management fees, costs, and expenses and cannot be invested in directly.
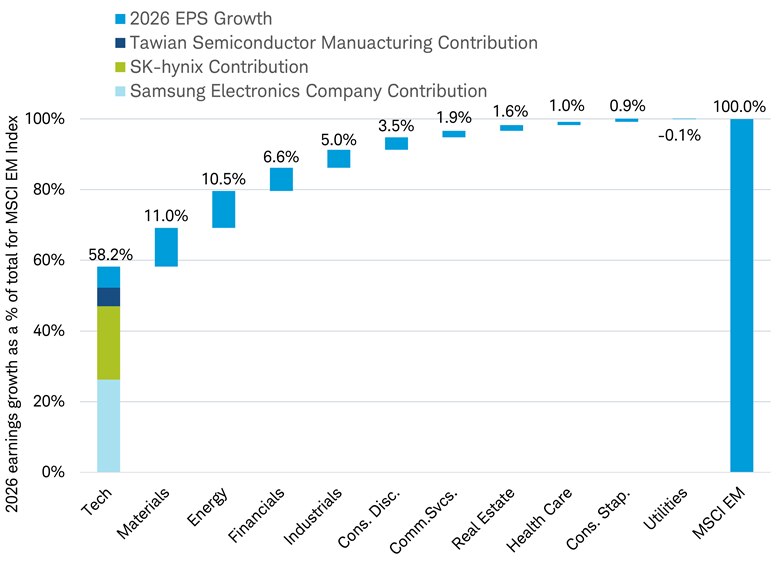
So why does the overall index have such strong earnings growth expectations while the earnings for the majority of companies are being revised downward? Driven by global AI capital spending (capex), semiconductor companies based in Taiwan and South Korea are contributing to index earnings at a much higher level than their representation in the index. The three largest semiconductor companies, Taiwan Semiconductor Manufacturing, Samsung Electronics Co., and SK Hynix Inc., represent slightly over one-quarter of the MSCI EM Index, yet account for half of the index's earnings growth expected in 2026. In the index, technology company earnings as a whole are expected to grow 159% in 2026 according to FactSet estimates, representing 58% of overall EM earnings growth. This degree of concentration underscores how dependent the index has become on one theme.
Tech is contributing more than half of expected EM earnings in 2026
Source: Charles Schwab, MSCI, FactSet data as of 5/1/2026.
All names and market data shown are for illustrative purposes only and are not a recommendation, offer to sell, or a solicitation of an offer to buy any security. The Global Industry Classification Standard (GICS) was developed by and is the exclusive property of Morgan Stanley Capital International Inc. and S&P Capital IQ. GICS is a service mark of MSCI and S&P Capital IQ and has been licensed for use by Schwab. Indexes are unmanaged, do not incur management fees, costs, and expenses and cannot be invested in directly.
Higher commodities prices due to the Iran war and the AI infrastructure buildout are also driving strong expected earnings growth for the Materials and Energy sectors, at 89% and 27% in 2026 respectively, according to FactSet estimates. This represents another 22% of total EM earnings growth. Technology, Materials, and Energy combined represent roughly 80% of 2026 earnings growth for the index. This has left emerging markets' earnings and overall performance vulnerable to any demand shifts in AI infrastructure or price drops in commodities.
Outside of semiconductor, energy, and materials companies, companies tied to domestic growth in emerging markets are not faring as well. Earnings estimates for both the MSCI China and MSCI India indexes, where consumer-oriented and financials have larger weights, have continued to face downward pressure according to FactSet. This reflects ongoing domestic economic challenges. The divergence of earnings revisions between AI-exposed companies in Taiwan and South Korea and domestic-oriented companies in China and India illustrate the risk an AI-spending slowdown could have on earnings of the MSCI EM Index.
EM is attractively valued, but earnings expectations and concentration matters
Emerging markets look inexpensive on a forward earnings basis, but that appearance depends on the durability of a highly concentrated semiconductor led earnings cycle. With a handful of companies representing a disproportionate share of expected earnings growth, EM is exposed to shifts in AI demand, semiconductor pricing, or future AI capex trends.
Valuations for EM appear inexpensive but are based on elevated earnings estimates
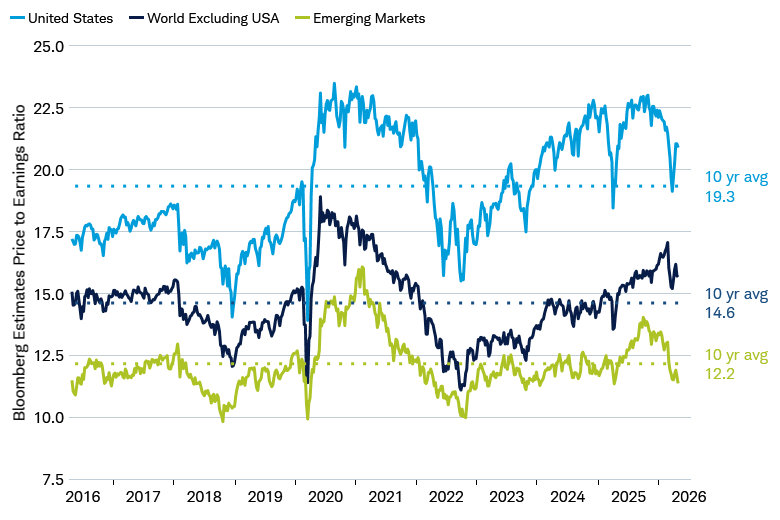
Source: Charles Schwab, Macrobond, as of 5/6/2026.
Forecasts contained herein are for illustrative purposes only, may be based upon proprietary research and are developed through analysis of historical public data. Indexes are unmanaged, do not incur management fees, costs, and expenses and cannot be invested in directly.
For investors, emerging markets in 2026 is less of a story about broad cyclical recovery and more one of selective participation. Understanding sector and country contributions—and recognizing how narrow today's earnings foundation has become—matters more than ever when assessing both the opportunity and the risk embedded in emerging markets.
Takeaway
Emerging market stocks have rebounded to new highs following their correction at the onset of the Iran war. However, unlike the broad performance trend in place prior to the war, the recent rally has been extraordinarily concentrated around AI. While capital spending on AI could continue to power emerging market stocks, the concentrated nature of recent earnings growth and returns means EM stocks are subject to the risk AI capex fails to live up to expectations. Moreover, if growth and inflation pressures continue to mount, which we see as likely to happen over coming months, downside risks to the equity market may rise.
Heather O'Leary, Senior Manager, Equity Research and Strategy, contributed to this report.