Weekly Trader's Outlook
Stocks Look to Register Modest Weekly Gains, Despite Rate Volatility, as Earnings from Hyperscalers Support Tech Rebound

The Week That Was
If you read last week's blog, you might recall that I had a "Moderately Bearish" outlook for the market this week, with a secondary forecast for "Higher volatility," given this week's potential catalysts. At the time of this writing, stocks are on track to be slightly higher on the week, so my forecast turned out to be wrong. Markets certainly were hit with volatility this week though, and particularly on Wednesday, following the wrap up of the Federal Open Market Committee (FOMC) meeting and subsequent press conference. The Dow Jones Industrial Average ended up closing down more than 1,000 points on Wednesday. While the Federal Reserve left rates unchanged, markets appeared to be frustrated with the lack of clarity in rate policy and yields spiked on the long end of the Treasury curve (more on this in the "Economic Data, Rates & the Fed" section below). Volatility was also seen overseas, as the Korean Composite Stock Price Index (KOSPI) dropped 10% on back-to-back days early in the week, but surged a record 17.91% in one session earlier today. The volatility in the tech/AI (artificial intelligence) complex has been experienced over the past month in large part due to excessive leverage and positioning, coupled with concerns around overspending and AI economics. Helping the tech snap back rally over the last 36 hours were strong earnings reports from Microsoft and Amazon, which showed exceptional cloud services growth (AMZN delivered highest AWS growth in 18 quarters, MSFT Azure revenue easily beat estimates and the company guided for acceleration in growth in the coming quarter). Additionally, MSFT said that paid Co-Pilot seats jumped to 30M from 20M in the last quarter, an acceleration from the 20M (from 15M) last quarter. I mentioned last week that I had some concerns over higher capital expenditures (CapEx) guidance from the hyperscalers, but since AMZN and MSFT delivered evidence of AI monetization, shares of both stocks jumped more than 15% post earnings. Also potentially assisting the bounce in tech stocks was news of the mid-week implosion of AI-focused hedge fund Situational Awareness. The hedge fund, founded by former OpenAI researcher Leopold Aschenbrenner, suffered heavy losses due to extreme leverage on semiconductor and AI infrastructure stocks, which forced a sale to Citadel, according to the Wall Street Journal (WSJ noted that neither Situational Awareness nor Citadel responded to requests for comments).
Regarding the Iran conflict, the U.S. and Iran agreed to pause attacks heading into the week, but U.S. Central Command subsequently intercepted a surprise attack by Iran 48 hours later and attacks by the U.S. have subsequently resumed. WTI crude prices are on track to be down 4.7% on the week, with September futures last seen trading up 1.76% to $85.06/barrel.
Tracking the Q2 earnings scorecard, the results continue to be very strong, even though the post-earnings reactions have been relatively sour. So far, 305 of the S&P 500 companies have reported results and 68% have beat estimates on the top line while 86% have beat on the bottom line. Perhaps more impressively (although we are only halfway through the season), earnings per share (EPS) growth is currently tracking at 57.00% and revenue growth is at 14.81%.
Outlook for Next Week
At the time of this writing (2:40 p.m. ET) stocks are mostly higher (sans RUT), and near the highs of the day (DJI + 308, SPX + 45, $COMP + 203, RUT - 9), which appears to be assisted by the continued rebound in tech stocks. The tech/AI infrastructure cohort had reached a severely oversold state by Wednesdays close (more on this in the "Technical Take" section below), coupled with encouraging evidence of traction around AI monetization (thank you MSFT and AMZN), that the money flow has poured back into this space over the past two days. There could be more near-term upside to this rebound early next week, but I also acknowledge some outlier risks. Specifically, the lack of progress in negotiations between the U.S and Iran and rising Treasury yields on the long end of the curve. Yields on the 30-year are at a fresh cycle high of 5.273% and yields on the 10-year are up eight basis points to 4.741%, the highest level since January 2025. I'm not sure how bullish I can be in the face of rising yields and the potential for a spike in (or higher-for-longer) oil prices in the coming weeks. Higher Treasury yields are economically restrictive, they compress the equity risk premium (stocks become relatively less attractive), which can divert money flow away from stocks are toward higher-yielding, safer investments. Lastly, we are entering a more bearish seasonal period for stocks, historically speaking, as we enter the August/September timeframe. Yes, late August/September is more bearish, but it's prudent to point out right now. On the bullish side of things, the technicals on the S&P 500 Equal Weight Index (SPXEW) are sound, and the index continues to methodically climb higher. Also, earnings have been exceptionally strong, and now AMZN and MSFT have helped ease concerns around AI economics. Lastly, if yields or oil prices decline next week, this would likely be enough of an excuse for investors to dip buy in the tech space, which would lift overall market sentiment. Therefore, I'm a little torn as to providing a forecast for next week, especially since I don't know which way yields and oil prices are going to trend. I will provide an overall "Cautious" forecast for stocks next week, since I do feel that the potential bearish factors outweigh the potential bullish factors in the near-term. What could challenge my forecast? As I stated above, lower oil prices and yields would likely lift stocks, and the tech/AI complex is still technically oversold, and there could be follow-through upside momentum next week.
Other Potential Market-Moving Catalysts
Economic:
- Monday (Aug. 3): Construction Spending, ISM Manufacturing Index
- Tuesday (Aug. 4): Business Inventories, Factory Orders, Trade Balance
- Wednesday (Aug. 5): ADP Employment Change, EIA Crude Oil Inventories, ISM Non-Manufacturing Index, MBA Mortgage Applications Index
- July 30th – 31st: Bank of Japan (BOJ) Monetary Policy Meeting
- Thursday (Aug. 6): Continuing Claims, EIA Natural Gas Inventories, Initial Claims, Productivity-Preliminary, Unit Labor Costs, Wholesale Inventories
- Friday (Aug. 7): Average Hourly Earnings, Average Workweek, Consumer Credit, Nonfarm Payrolls, Unemployment Rate
Earnings:
- Monday (Aug. 3): CNA Financial Corp. (CNA), CNH Industries NV (CNH), Diamondback Energy Inc. (FANG), Ecopetrol SA (EC), Hess Midstream LP (HESM), Krystal Biotech Inc. (KRYS), Marriott International Inc. (MAR), ONEOK Inc. (OKE), Palantir Technologies Inc. (PLTR), Tyson Foods Inc. (TSN), Vertex Pharmaceuticals Inc. (VRTX)
- Tuesday (Aug. 4): Advanced Micro Devices Inc. (AMD), Amgen Inc. (AMGN), Arista Networks Inc. (ANET), BP PLC (BP), Caterpillar Inc. (CAT), Cummins Inc. (CMI), Duke Energy Corp. (DUK), EOG Resources Inc. (EOG), Gilead Sciences Inc. (GILD) McDonald's Corp. (MCD), Merck & Co. (MRK), Pfizer Inc. (PFE), Space Exploration Technologies Corp. (SPCX), Toyota Motor Corp. (TM)
- Wednesday (Aug. 5): Allstate Corp. (ALL), AppLovin Corp. (APP), Brookfield Asset Management (BAM), CVS Health Corp. (CVS), DoorDash Inc. (DASH), Eli Lilly & co. (LLY), McKesson Corp. (MCK), MercadoLibre Inc. (MELI), Novo Nordisk A/S (NVO), SanDisk Corp. (SNDK), Shopify Inc. (SHOP), Uber Technologies Inc. (UBER), Walt Disney Co. (DIS), Western Digital Corp. (WDC)
- Thursday (Aug. 6): Aflac Inc. (AFL), Airbnb Inc. (ABNB), American International Group Inc. (AIG), Becton Dickinson and Co. (BDX), Cheniere Energy Inc. (LNG), Cloudflare Inc. (NET), ConocoPhillips (COP), Constellation Energy Corp. (CEG), Datadog Inc. (DDOG), Howmet Aerospace Inc. (HWM), Monster Beverage Corp. (MNST), Parker-Hannafin Corp. (PH), Sempra (SRE), Targa Resources Corp. (TRGP)
- Friday (Aug. 7): Almonty Industries Inc. (ALM), CG Oncology Inc. (CGON), Flour Corp. (FLR), Hawaiian Electric Industries Inc. (HE), Oklo Inc. (OKLO), Plains All American Pipeline LP (PAA), Plains GP Holdings Inc. (PAGP), PPL Corp. (PPL), Take-Two Interactive Software Inc. (TTWO), Vistra Corp. (VST)
Economic Data, Rates & the Fed
There was a solid dose of economic data this week, which was highlighted by the Federal Open Market Committee (FOMC) meeting and monthly Personal Consumption Expenditures (PCE) Prices report. Wednesday's FOMC decision to leave rates unchanged, while maintaining a firm stance on price stability, generated a lot of volatility in both the equity and bond market. The general stance from analysts and reports during the follow-up press conference can be summarized in the following way, "If the Fed is so intently focused on bringing inflation down its 2.0% target, what are you waiting for?" The inaction appears to have softened the chances of a rate hike at the upcoming September FOMC meeting (currently showing a 67% probability of a hike). On the inflation front, PCE Prices were modestly cooler than expected, but keep in mind that oil prices have been on the rise over the past two weeks and the Iran conflict is ongoing. Here's a breakdown of the reports:
- FOMC Meeting/Rate Decision: The Federal Open Market Committee (FOMC) held its benchmark interest rate steady at 3.50-3.75%, in a 9-3 vote (vs. a 12-0 vote in June). The three officials dissenting in favor of a hike were: Beth Hammack, Lorie Logan, and Neel Kashkari. Other than that, the only other modification to June's statement was the following: "The Committee
reaffirmedis continuing its policy of maintaining ample reserves in the banking system." - PCE Prices: The June headline Personal Consumption Expenditures Prices Index decreased 0.1% from the prior month (versus the -0.2% expected), which puts the annual headline increase at 3.7% (below the +3.8% expected). On a core basis, June PCE Prices increased 0.1% (in line with estimates), bringing the annual core increase to +3.3% (below the +3.4% expected).
- Q2 GDP – Advanced Reading: Gross Domestic Product rose 1.5% in the second quarter, according to the advanced reading from the U.S. Bureau of Economic Analysis. The estimate was well below the +2.1% FactSet forecast. Commenting on the report, Piper Sandler managing director and deputy head of economic research Jake Oubina stated, "From a GDP math standpoint, a lot of the AI-related capital expenditure, which adds substantially to GDP, gets offset by the fact that we import most of what goes into the data centers."
- Personal Income: 0.2% vs. 0.2% expected
- Personal Spending: 0.3% vs. 0.3% expected
- Durable Goods: 0.6% vs. 1.0% est.
- Durable Goods ex-transportation: 0.3% vs. 2.7% est.
- Consumer Confidence: 90.8 vs. 90.6 est.
- Chicago Purchasing Managers' Index (PMI): The Chicago Business Barometer came in at 57.6 for July, which was up from 56.7 in June and above the 56.0 economists had expected.
- EIA Crude Oil Inventories: -7.17M barrels
- EIA Natural Gas Inventories: +28 bcf
- Initial Jobless Claims: Initial applications for US jobless benefits increased 9K from last week's (upwardly revised) 188K to 197K. Continuing Claims dropped by 7K from the (downwardly revised) prior week to a seasonally adjusted 1.782M (below expectations for 1.795M).
- The Atlanta Fed's GDPNow initial "nowcast" for Q3 GDP is 5.0%.
Longer-term U.S. Treasury yields pushed higher this week which resulted in some steepening of the curve. In fact, 30-year yields are at a fresh cycle high today. There are several factors that can impact the long end of the curve, but this week's FOMC meeting was certainly catalyst. Compared to last Friday, two-year Treasury yields are down ~2 basis points (4.295% vs. 4.311%), 10-year yields are up ~2 basis points (4.735% vs. 4.714%) while 30-year yields jumped ~13 basis points (5.264% vs. 5.137%).
Market expectations around a potential rate hike from the Federal Reserve eased some this week, despite Warsh reiterating the committee's focus on price stability. There was roughly a 34% chance that the Fed would hike heading into this week's FOMC meeting, but perhaps the fact that Warsh and crew did not raise rates led to expectations of a less aggressive Fed (despite the strong tone). Per Bloomberg, the probability of a Fed rate hike at the September FOMC is down to 67% today from last week's theoretical 100% probability of a hike. Looking further out, the probabilities suggest that the Fed will deliver two 25-basis-point hikes by the March FOMC meeting, which is consistent with last week.
Technical Take
S&P 500 Equal Weight Index (SPXEW - 8 to 8,714)
The S&P 500 Equal Weight (SPXEW) notched a fresh all-time high this week as the index continues to stair-step higher in an established uptrend. Yes, the market-cap weighted S&P 500 (SPX) has recently dropped below its 50-day Simple Moving Average, and the technicals lean a little more bearish there, but the relative outperformance in the SPXEW speaks to the continued broadening of the rally. Although weakness in technology could eventually weigh on overall market sentiment and hit the SPXEW at some point, the near-term technicals are bullish.
Near-term technical translation: bullish
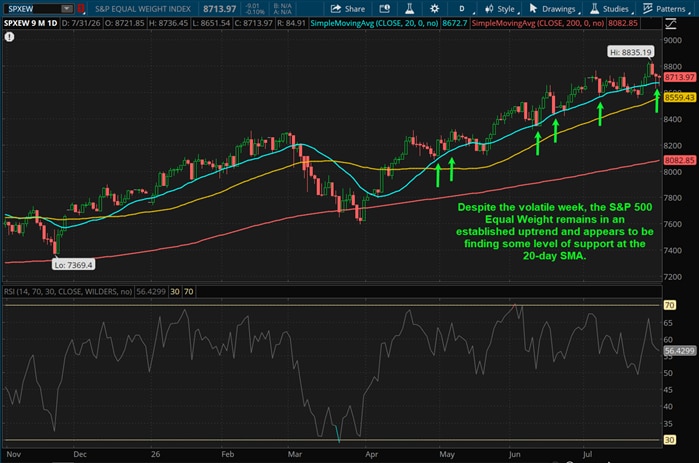
Source: ThinkorSwim trading platform
Past performance is no guarantee of future results.
Nasdaq 100 Index (NDX + 178 to 28,284)
The Nasdaq 100 index (NDX) was down 3.3% from Monday through Wednesday's close but is on track to have recovered all of that decline at the time of this writing (1:37 p.m. ET). The snapback bounce appears to be driven by a) a near-term oversold technical state and b) strong earnings/guidance from MSFT/AMZN that helped validate the AI monetization concerns. Regarding Wednesday's oversold state, the Relative Strength Index (RSI) on the NDX hit 32, its lowest reading since the Iran war-induced sell-off in March, when the RSI hit 29. Near-term, there could still be some fuel in this oversold bounce that is underway, but from a longer-term perspective the index still needs some technical healing. Therefore, near-term I put the technicals in the slightly bullish camp (only "slightly" because the snapback over the last 36 hours has been fierce), but from an intermediate-term basis the technicals lean bearish in my view.
Near-term technical translation: slightly bullish (potentially to the underside of the 50-day SMA)
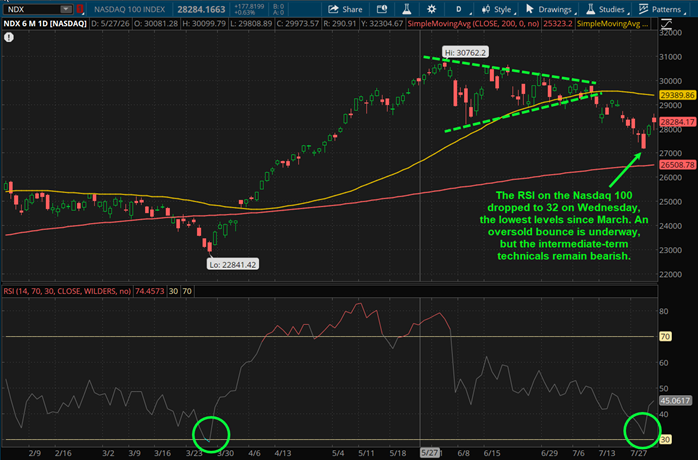
Source: ThinkorSwim trading platform
Past performance is no guarantee of future results.
Cryptocurrency News
The Bitwise 10 Large Crypto Index is down 2% since last Friday, with bitcoin down 2% and ether flat at the time of writing. Earlier in the week, bitcoin demonstrated resilience in the face of rising yields following the FOMC's decision to keep rates unchanged, then rallied yesterday along with other risk assets. The broader crypto market is down today, potentially due to a security flaw in some crypto wallets resulting in approximately $38 million of bitcoin being stolen. The issue appears to be that the random number generator used in the wallets to generate seed phrases was not a true random number generator and ended up being predictable, so hackers, presumably using AI, were able to figure out the private keys, ultimately stealing $38 million from 500 cold wallets.
Over the past month, ether has outperformed bitcoin, leading investors to question whether this could be the start of an "alt season." Historically, altcoin outperformance is a late-cycle feature, but in bear market recoveries, altcoins have staged short-term rallies where they have outperformed bitcoin. That may be what is happening with ether now, and it's important to note that these periods of outperformance are historically short-lived.
Understanding the drivers of these rallies can help inform their sustainability. Ether's recent rally has been supported by rising GDP (the sum of fees generated across the entire Ethereum network, including layer-2 blockchains and applications). Diving a bit deeper into the sources of the activity, the recent jump appears to correspond to increased usage of the Sky protocol, a DeFi platform that issues an over-collateralized USDS stablecoin and allows users to earn yield on their deposits. Looking at year-to-date fees from Sky, increases tend to be sporadic, supporting the notion that ether's recent outperformance may be short-lived. That said, protocol-level data only captures ~90% of the total Ethereum network GDP, and the remaining 10% could also explain the recent strength. While Robinhood Chain has been in the news recently, it has only generated $3.4 million in fees since it launched a month ago, less than 1% of Ethereum GDP over that period, and is unlikely to be the reason for the rally.
Ether's recent rally has been driven by rising activity on the Ethereum network
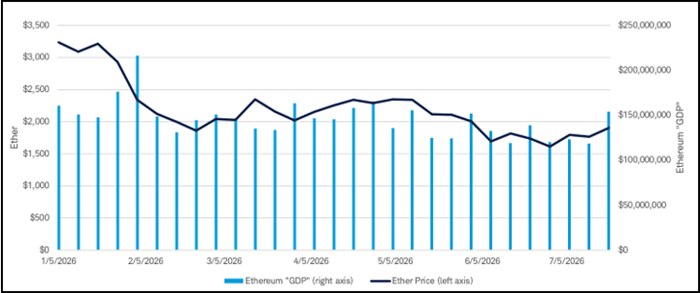
Source: Token Terminal, Schwab as of July 29, 2026
Sky appears to be the protocol that is driving the increase in Ethereum GDP in recent weeks
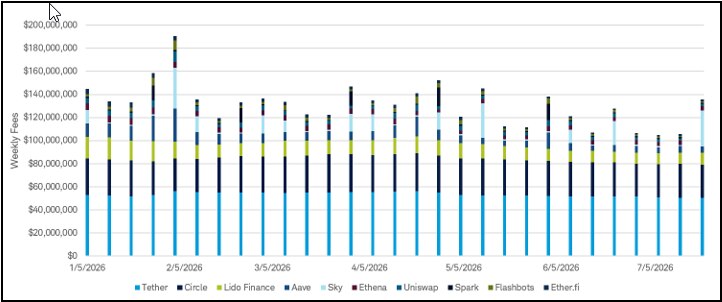
Source: Token Terminal, Schwab as of July 29, 2026
Jim Ferraioli, Director of Digital Currencies Research and Strategy, authored this report.
Market Breadth
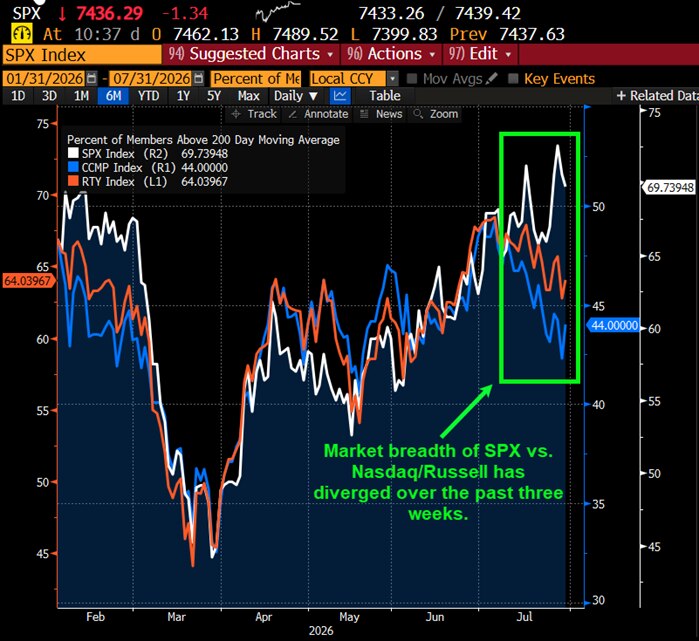
The Bloomberg chart below shows the current percentage of members within the S&P 500 (SPX), Nasdaq Composite (CCMP) and Russell 2000 (RTY) that are trading above their respective 200-day Simple Moving Averages (SMA). In short, market breadth on the SPX (as measured by the percentage of stocks above the 200-day SMA) improved, while the CCMP & RUT were little changed. More notably, market breadth on the Nasdaq and Russell has been contracting over the past three weeks, which likely reflects the significant correction in the tech/momentum cohort. Compared to last Friday, the SPX (white line) breadth improved to 69.73% from 65.93%, the CCMP (blue line) is essentially unchanged at 44.00% vs. 43.54%, and the RUT (red line) is also flat at 64.03% versus 63.36% (all week-over-week).
Source: Bloomberg L.P.
Market breadth attempts to capture individual stock participation within an overall index, which can help convey underlying strength or weakness of a move or trend. Typically, broader participation suggests healthy investor sentiment and supportive technicals. There are many data points to help convey market breadth, such as advancing vs. declining issues, percentage of stocks within an index that are above or below a longer-term moving average or new highs vs. new lows.
This Week's Notable 52-week Highs (58 today): Apple Inc. (AAPL - $28.20 to $305.22), Autonation Inc. (AN - $16.94 to $197.71), Chubb Ltd. (CB - $1.58 to $348.57), Extra Space Storage Inc. (EXR - $0.70 to $147.51), Public Storage Inc. (PSA + $0.80 to $318.25), Snowflake Inc. (SNOW + $3.61 to $301.71)
This Week's Notable 52-week Lows (51 today): Core & Main Inc. (CNM - $0.05 to $43.48), Coreweave Inc. (CRWV - $1.87 to $72.03), Kratos Defense & Security Inc. (KTOS - $0.32 to $45.85), Lennox International Inc. (LII + $2.49 to $419.94), MP Materials Corp. (MP + $0.43 to $42.09), Watsco Inc. (WSO - $2.65 to $308.08)