Looking to the Futures
Bears make Money, Cows get Slaughtered

Live cattle futures closed 2.54% lower as traders speculate the direction of the market with light demand in the cash market. Live cattle futures for April delivery, /LEJ26, settled at $235.6 per cwt, down $6.2 per cwt from previous settlement.
Demand in the cash market is “mostly inactive” as reported on the USDA afternoon national slaughter report. The last established market was last week in all 5 regions. Last week’s 5 region average cattle prices were ~$240 for live and ~$376.50 for dressed. Slaughter estimates ended at an estimate of 351,000 heads for the week ending February 1st.
Wholesale boxed beef is lower, as reported in the Thursday afternoon report, with a choice/select spread at $6.88. Choice boxes were down $0.77 to $367.25, select was down $1.72 to $360.37. Daily cattle slaughter estimates to be at 114,000 head, bringing the week to date to 450,000 head, up 14,000 head from previous week.
USDA has taken new measures in responding to the New World Screwworm (NWS) infestation south of the border. On January 30, they announced a dispersal shift to the southern border and 50 miles into Texas, and dispersing 100M sterile flies weekly.
Texas has also taken new steps in combating NWS, last Thursday, Texas Governor Greg Abbott issued a proclamation declaring a state of disaster for all Texas counties. This declaration frees up resources and “red tape” for the state to quickly respond and contain an infestation event.
The FDA has also been participating in the mitigation effort by conditionally approving drugs designed to treat an active NWS infestation. On February 5th, 2026, the FDA issued an emergency use authorization of Ivomec (ivermectin) to prevent infestations of NWS. Ivomec is an over-the-counter drug used to control parasites like worms, grubs, lice, etc., and it is reasonable to assume it may be effective against NWS infestations. The order states the drug can be applied “within 24 hours of birth, at the time of castration, or when a wound appears,” and is not permitted for treatment in dairy cows producing milk for human consumption. After treatment, cattle must wait 35 days before they are eligible to be sent to slaughter.
The US was notified of the current NWS outbreak on November 22, 2024, by Mexico’s Chief Veterinary Officer. The US responded by restricting the importation of animal commodities (cattle and bison). On February 1, 2025, the US reopened imports of cattle and bison from Mexico under additional inspection protocols. On May 11, 2025, Secretary Rollins announced the closure of the southern border to animal imports after NWS was detected 700 miles from the southern border in Oaxaca and Veracruz. On July 9, 2025, the US closes the southern border to all livestock trade and scraped the strategy to reopen southern ports of entry after NWS was detected 370 miles south of the US border.
Technicals
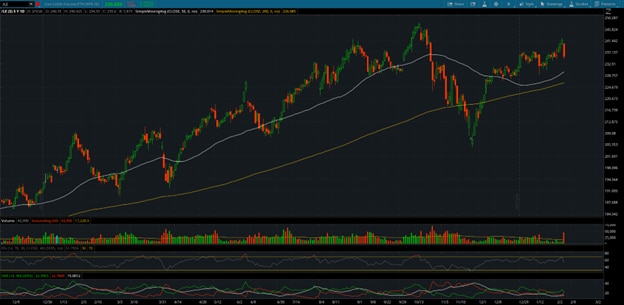
Live cattle futures for April delivery, /LEJ26, settled at $235.6 per cwt, down $6.2 per cwt from previous settlement. Live cattle saw a pull pack in Thursday’s trading after the active month rolled to April.
Live cattle futures remain above the 50- and 200-day simple moving averages, which is considered a bullish trend. The 50-day SMA is at 230.014, and the 200-day SMA is at 226.085.
The 14-day RSI pulled back from nearing the 70% overbought threshold, peaking at 68.215, and closing at 51.8%. The rollover and the nearing the overbought threshold may indicate a technical cool-off in trading.
The directional movement index points to a possible reversal of a weak bullish trend. The ADX is low at 15, which is a sign of the weakness. The positive and negative moving index converged on each other, with the negative slightly overtaking the positive.

Contract Specifications

Economic Calendar
- University of Michigan Consumer Sentiment – Preliminary 10:00 AM ET
- Consumer Credit 3:00 PM ET
New Products
New futures products are available to trade with a futures-approved account on all thinkorswim platforms:
- Ripple (/XRP)
- Micro Ripple (/MXP)
- Micro Corn (/MZC)
- Micro Wheat (/MZW)
- Micro Soybean (/MZS)
- Micro Soybean Oil Futures (/MZL)
- Micro Soybean Meal Futures (/MZM)
- 1 OZ Gold (/1OZ)
- Solana (/SOL)
- Micro Solana (/MSL)
Visit the Schwab.com Futures Markets page to explore the wide variety of futures contracts available for trading through Charles Schwab Futures and Forex LLC.